Copyright
©The Author(s) 2018.
World J Gastroenterol. Feb 14, 2018; 24(6): 706-715
Published online Feb 14, 2018. doi: 10.3748/wjg.v24.i6.706
Published online Feb 14, 2018. doi: 10.3748/wjg.v24.i6.706
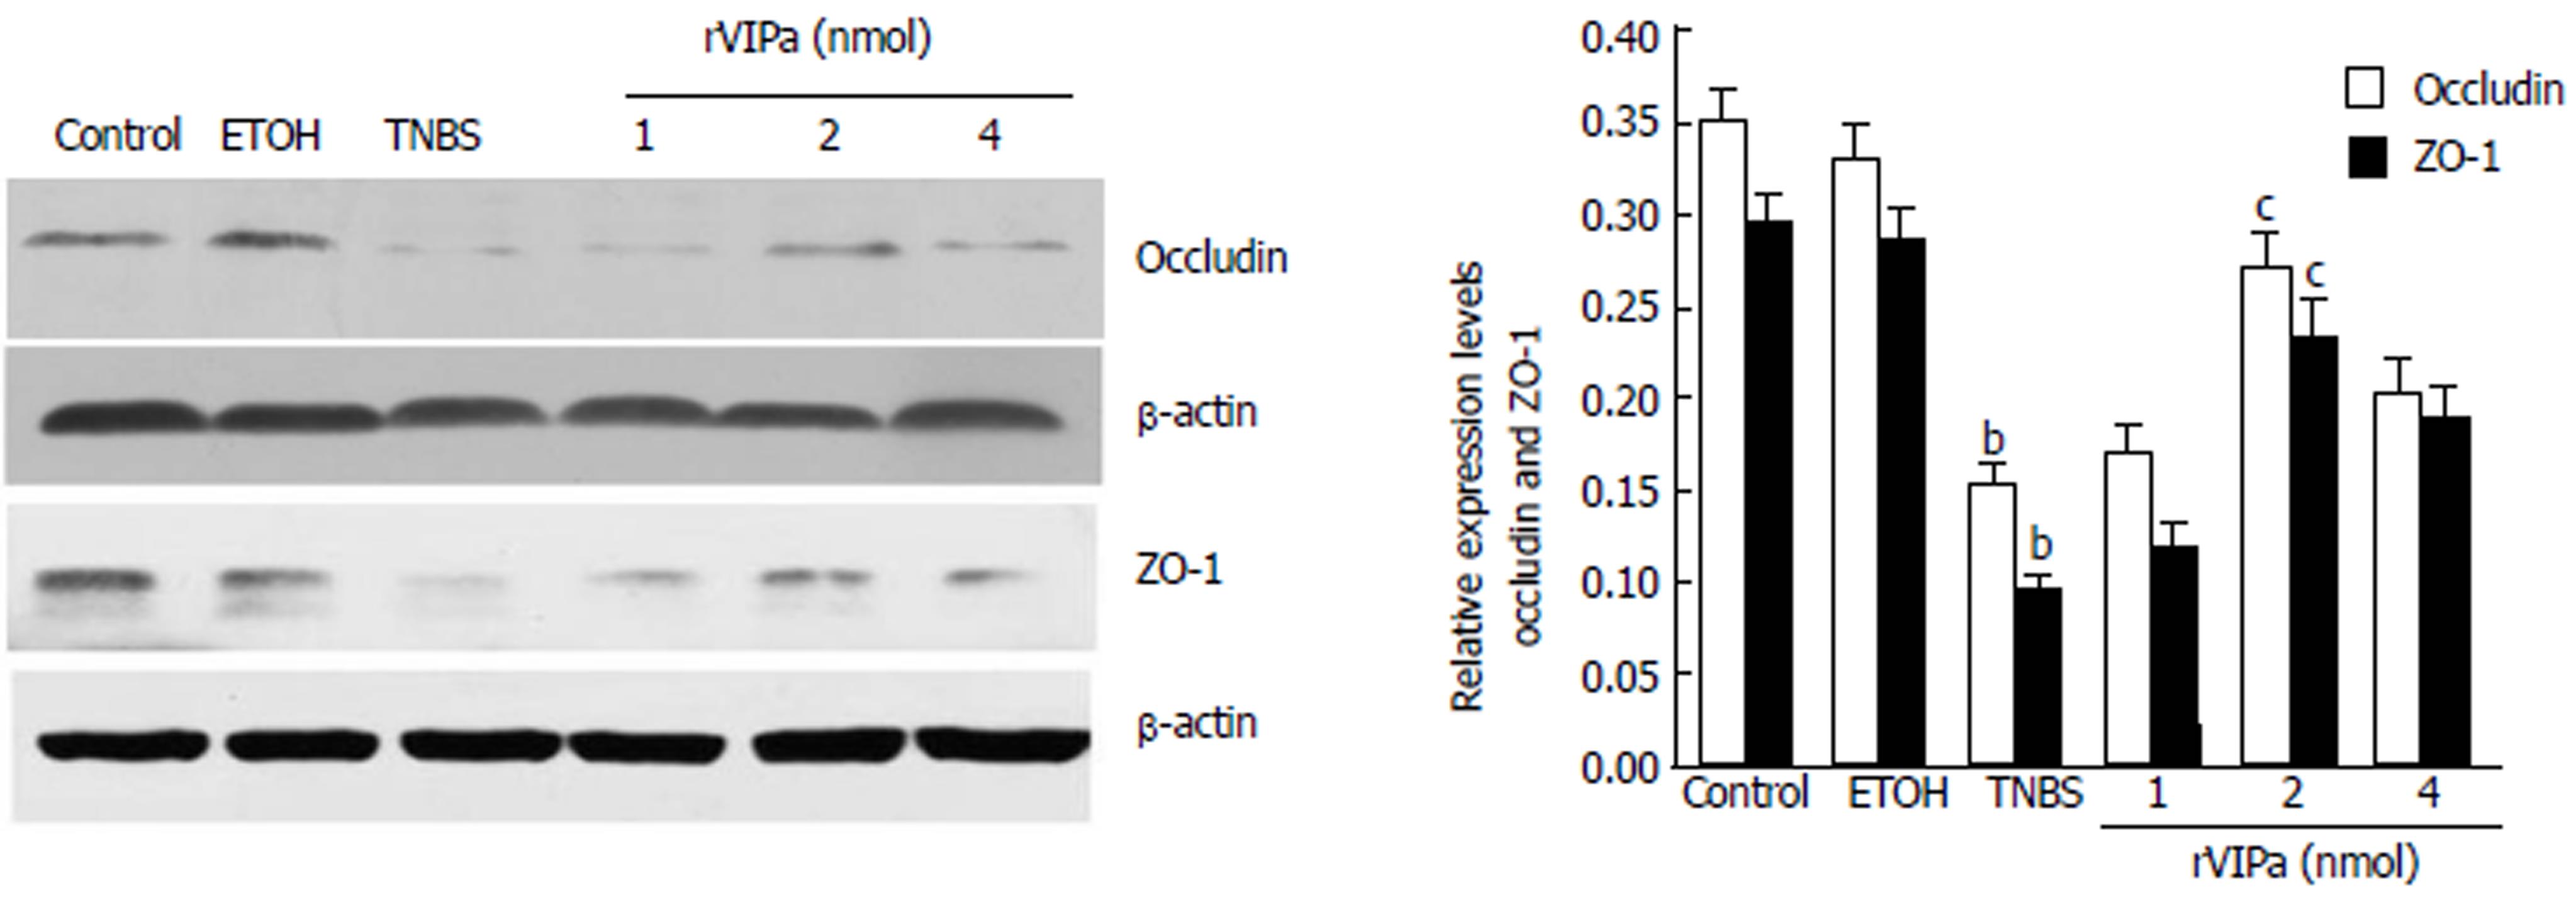
Figure 5 Protein expression level of occludin and ZO-1 in colon.
Data represent mean ± SEM (n = 8). bP < 0.01 vs control rats; cP < 0.05 vs TNBS-induced model rats. rVIPa: Recombinant expressed vasoactive intestinal peptide analogue; TNBS: Trinitrobenzene sulfonic.
- Citation: Xu CL, Guo Y, Qiao L, Ma L, Cheng YY. Recombinant expressed vasoactive intestinal peptide analogue ameliorates TNBS-induced colitis in rats. World J Gastroenterol 2018; 24(6): 706-715
- URL: https://www.wjgnet.com/1007-9327/full/v24/i6/706.htm
- DOI: https://dx.doi.org/10.3748/wjg.v24.i6.706


