Copyright
©The Author(s) 2018.
World J Gastroenterol. Feb 14, 2018; 24(6): 706-715
Published online Feb 14, 2018. doi: 10.3748/wjg.v24.i6.706
Published online Feb 14, 2018. doi: 10.3748/wjg.v24.i6.706
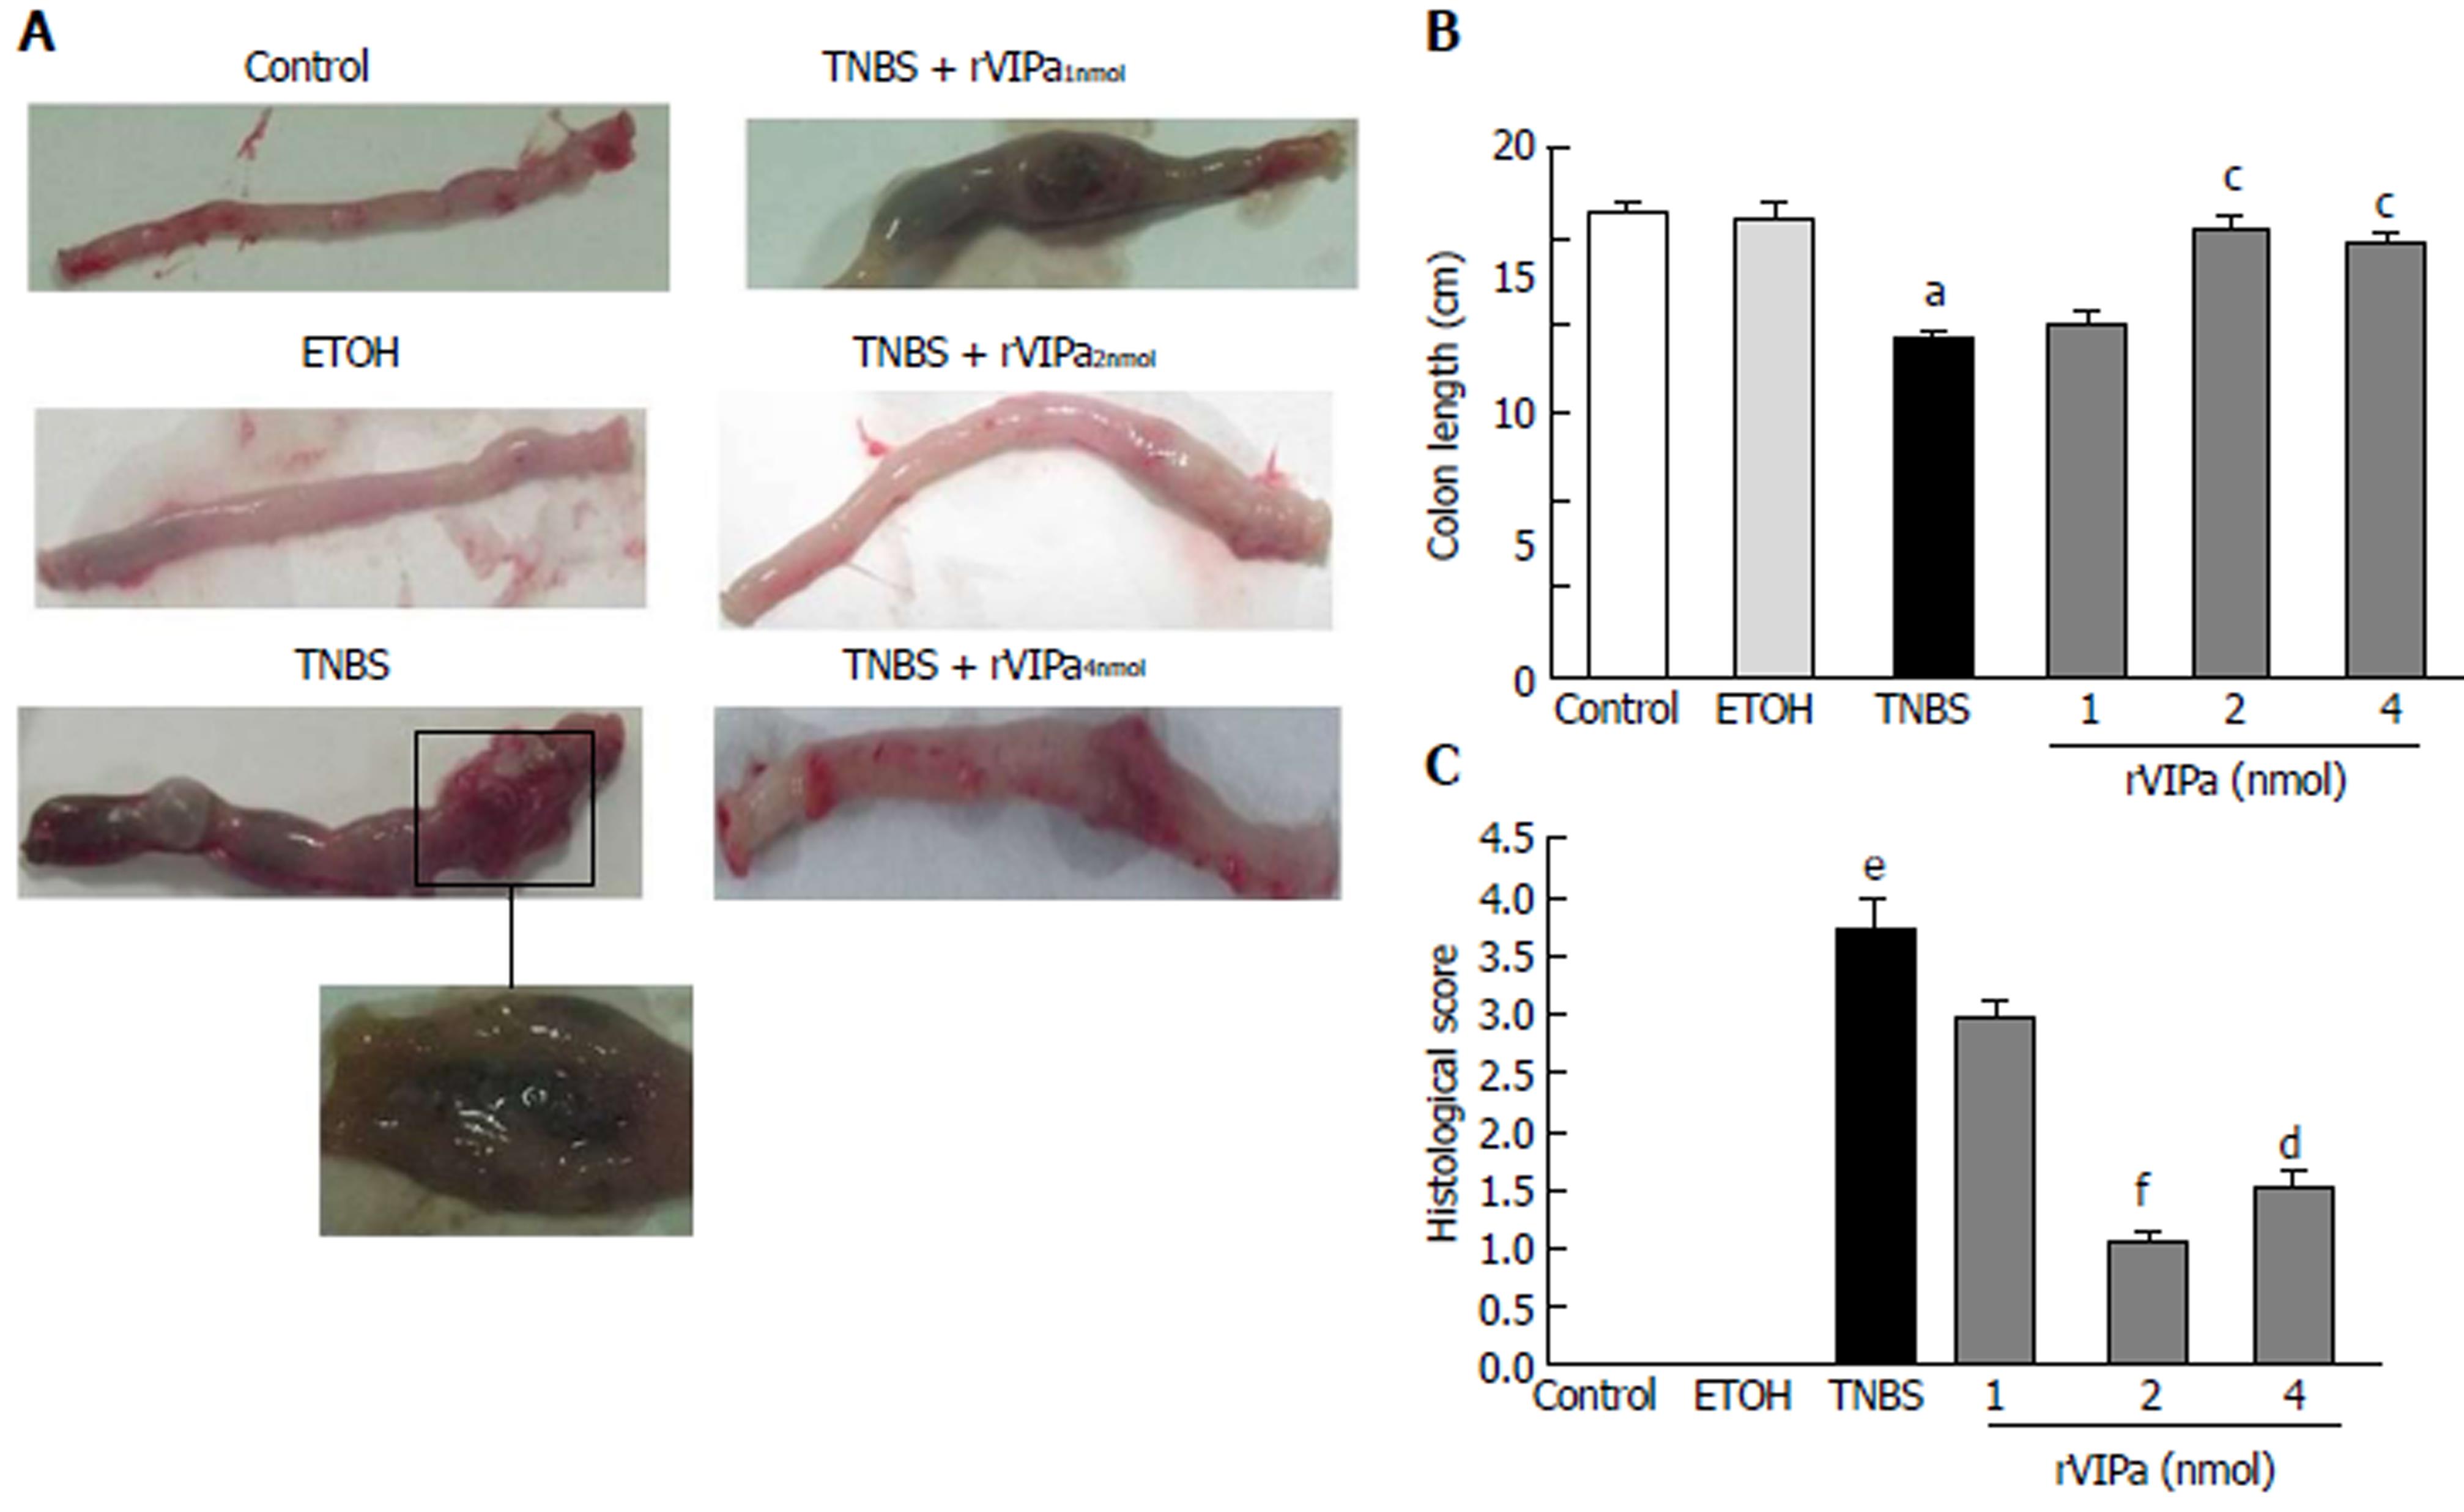
Figure 2 Histological observation and evaluation of colon tissue.
A: Visual inspection of TNBS-induced colitis of colon tissue in rats and effect of rVIPa with different concentrations; B: Histologic score; C: Colon length. Data represent mean ± SEM (n = 8). aP < 0.05, eP < 0.001 vs control rats; cP < 0.05, dP < 0.01, fP < 0.001 vs TNBS-induced model rats.
- Citation: Xu CL, Guo Y, Qiao L, Ma L, Cheng YY. Recombinant expressed vasoactive intestinal peptide analogue ameliorates TNBS-induced colitis in rats. World J Gastroenterol 2018; 24(6): 706-715
- URL: https://www.wjgnet.com/1007-9327/full/v24/i6/706.htm
- DOI: https://dx.doi.org/10.3748/wjg.v24.i6.706


