Copyright
©The Author(s) 2018.
World J Gastroenterol. Feb 14, 2018; 24(6): 680-692
Published online Feb 14, 2018. doi: 10.3748/wjg.v24.i6.680
Published online Feb 14, 2018. doi: 10.3748/wjg.v24.i6.680
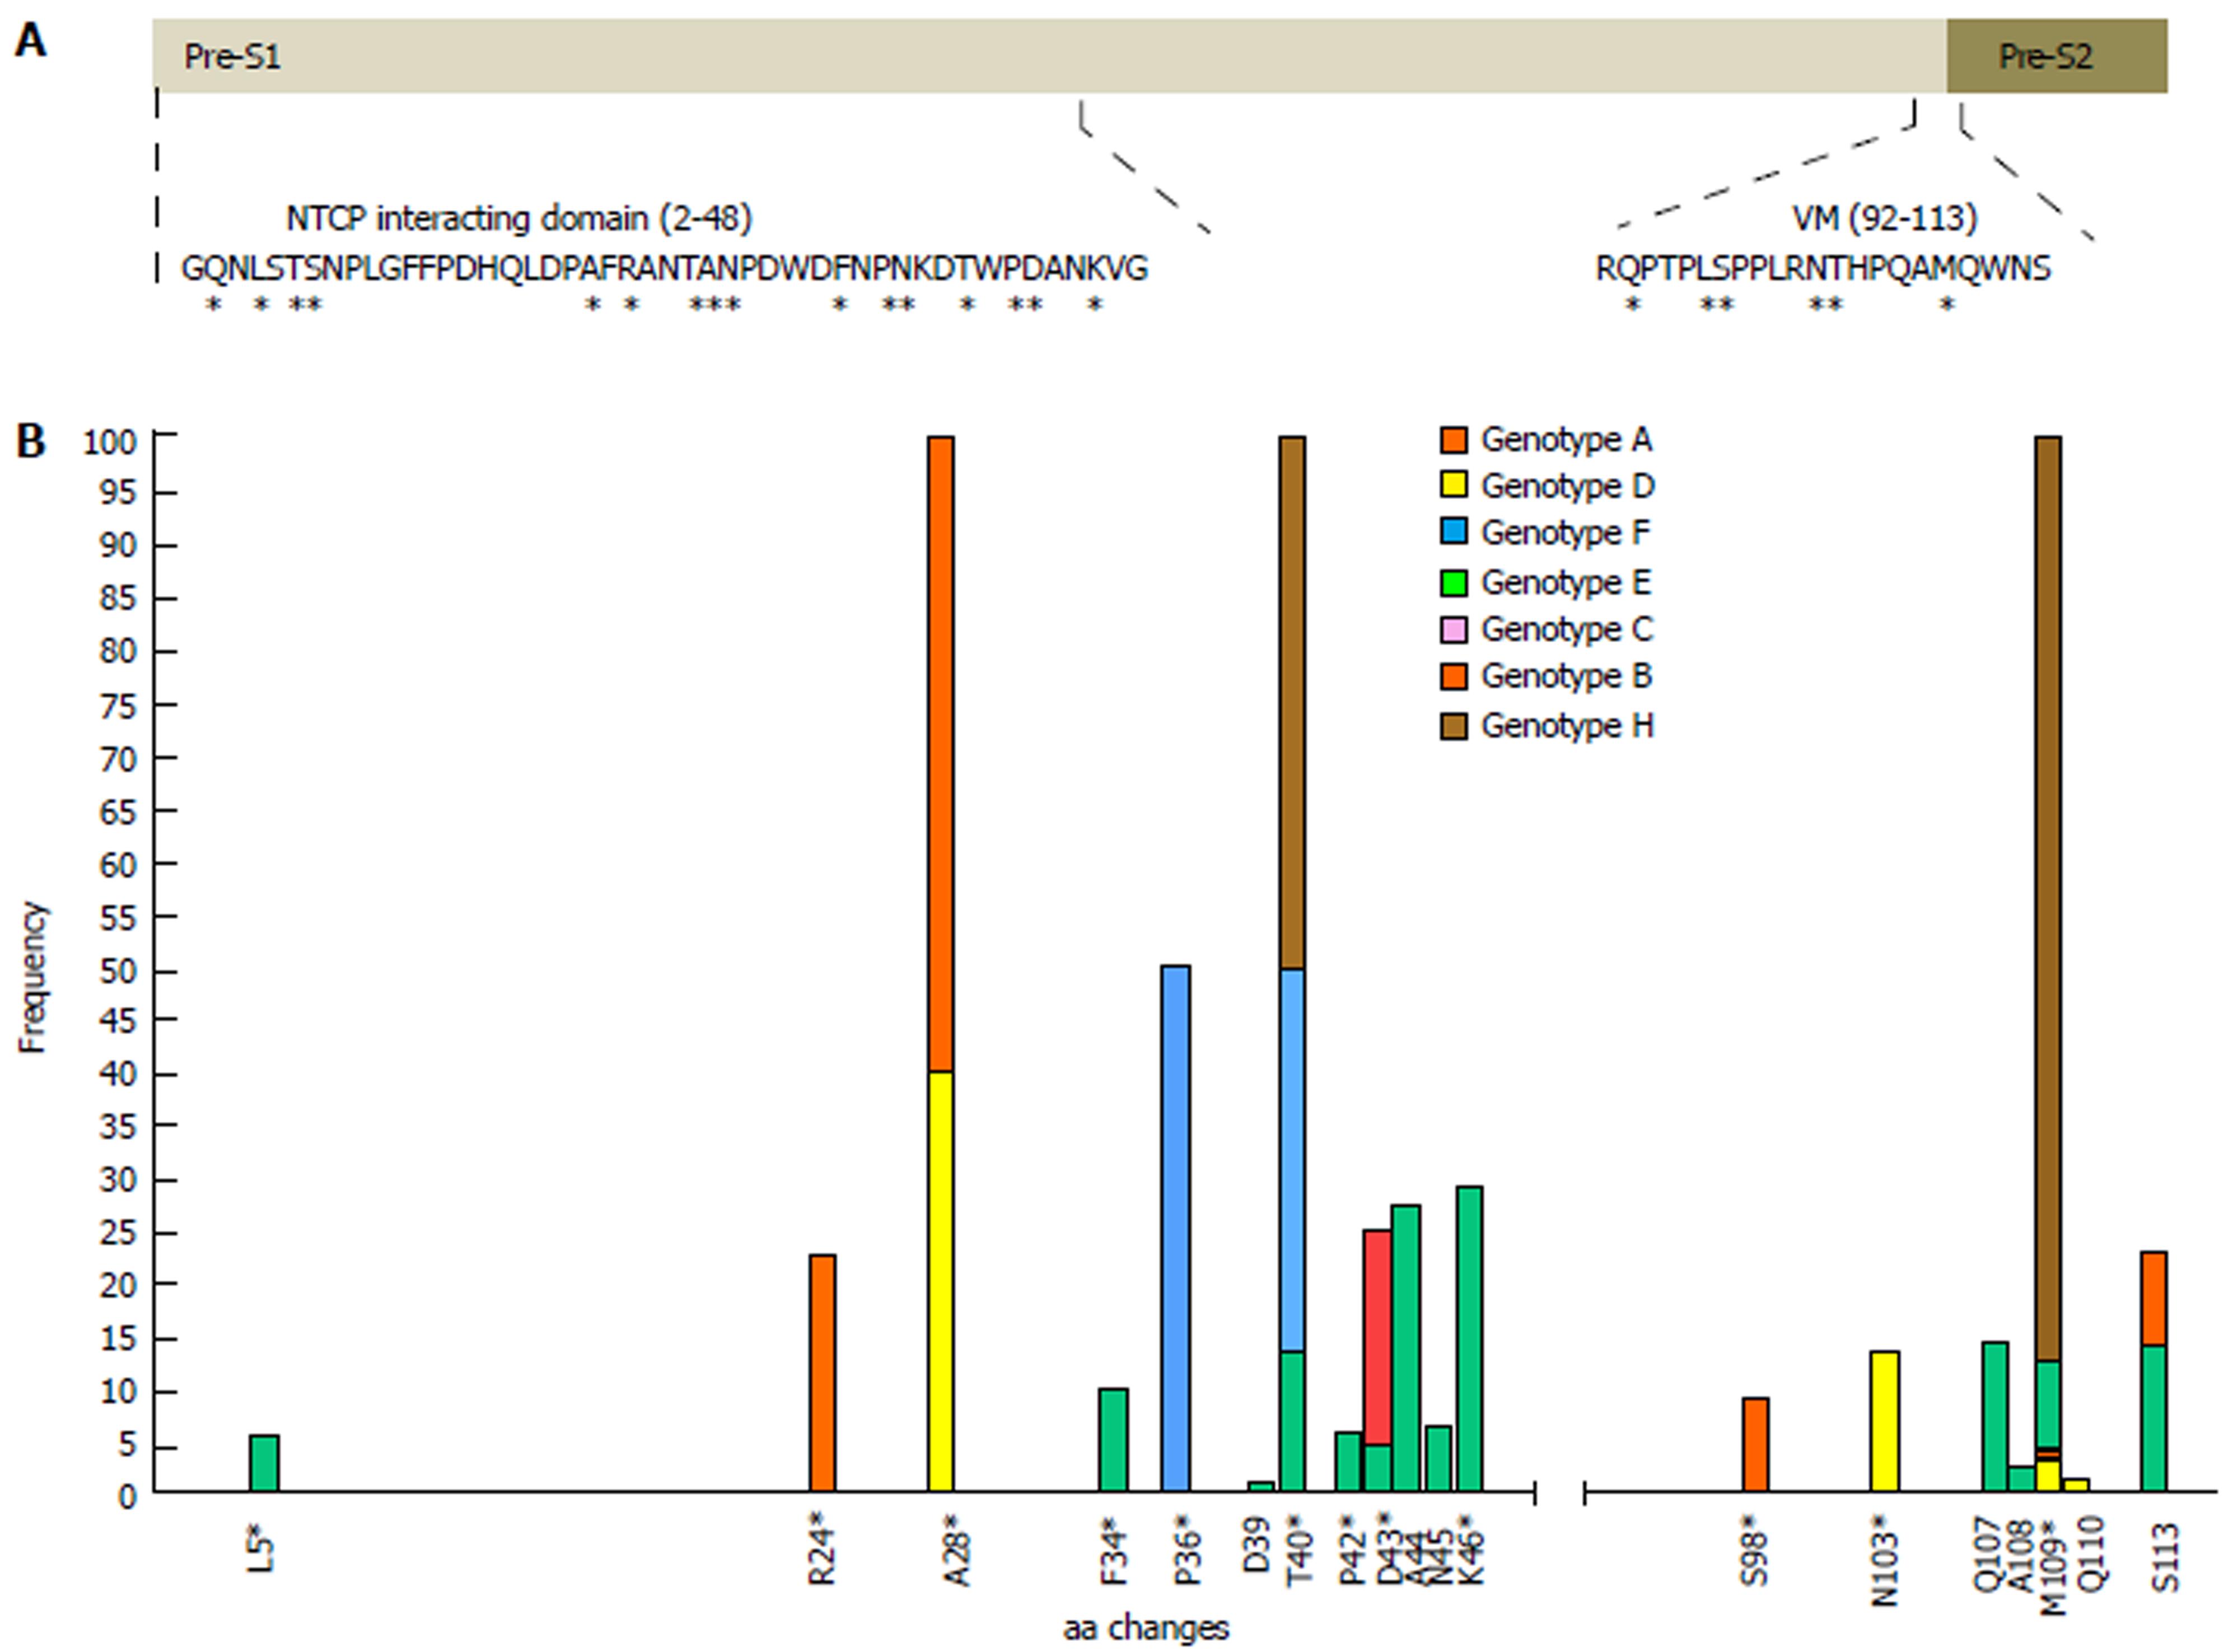
Figure 2 Frequency of amino acid changes in each position in the two domains studied.
In order to simplify the variations due to HBV genotype, the numeration of aa positions in both domains and their consensus sequences is presented according to genotype D (reference sequences obtained from GenBank, accession numbers provided in Supplementary table 1). Asterisks indicate positions where the wild-type aa varies according to HBV genotype. A: Schematic diagram where the two regions studied are represented: the sodium-taurocholate cotransporting polypeptide (NTCP)-interacting domain from residues 2 to 48 of the N-terminal end of preS1, and the virion morphogenesis (VM) domain from residues 92 to 108 of the C-terminal end of preS1 and the first 5 residues from the N-terminal end of preS2. B: Barplot representing the frequency of aa changes (above 1% of HBV quasispecies) within each HBV genotype in the NTCP interaction and virion morphogenesis domains (Specific aa changes are shown in Supplementary table 2).
- Citation: Casillas R, Tabernero D, Gregori J, Belmonte I, Cortese MF, González C, Riveiro-Barciela M, López RM, Quer J, Esteban R, Buti M, Rodríguez-Frías F. Analysis of hepatitis B virus preS1 variability and prevalence of the rs2296651 polymorphism in a Spanish population. World J Gastroenterol 2018; 24(6): 680-692
- URL: https://www.wjgnet.com/1007-9327/full/v24/i6/680.htm
- DOI: https://dx.doi.org/10.3748/wjg.v24.i6.680


