Copyright
©The Author(s) 2018.
World J Gastroenterol. Dec 28, 2018; 24(48): 5418-5432
Published online Dec 28, 2018. doi: 10.3748/wjg.v24.i48.5418
Published online Dec 28, 2018. doi: 10.3748/wjg.v24.i48.5418
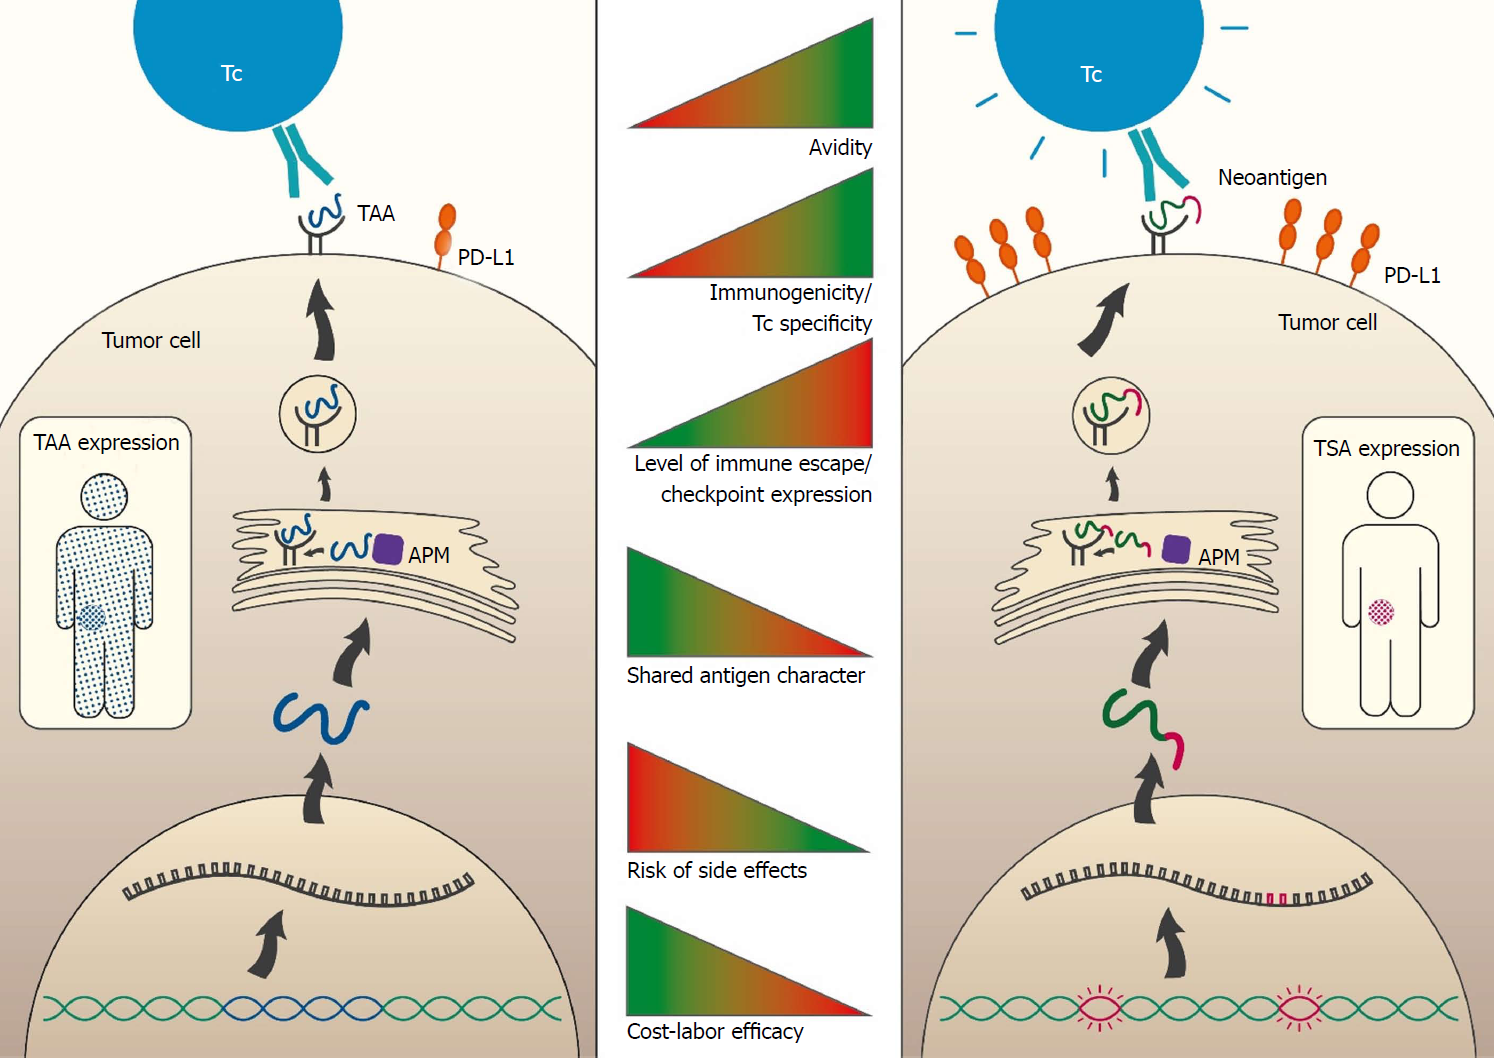
Figure 1 Comparison of tumor-associated antigens and tumor-specific antigens properties.
The figure depicts properties and processing steps of antigens which are either tumor associated (TAA; blue; left side) or tumor specific (TSA; pink; right side). The course until antigen processing includes the following steps: transcription of genomic locus (TAA, blue) or mutation containing locus (TSA; pink), translation and RNA processing, protein degradation and MHC molecule loading and finally presentation of the antigen (TAA or TSA) on the cell surface embedded in MHC molecules. TAA-proteins are expressed to a high level in the tumor and to a low level in other organs and tissues (blue sprinkled patient). The neo-antigenic part of the TSA-protein is solely expressed in the tumor (pink sprinkled tumor). Recognition of the tumor cell by T cells (Tc, e.g., CTL) takes place via the T cell receptor (TCR; green). The avidity is increased for TSAs (indicated by the “speedlines” on the right side of the Tc). The tumor may counteract the immune recognition by expression of immune checkpoint molecules such as PD-L1 (orange). This occurs to a much higher extent in TSA baring than in merely TAA baring tumors. The middle panel indicates the degree of T cell avidity (first bar), extent of immunogenicity/T cell specificity (second bar), level of immune escape / checkpoint expression (third bar), shared antigen character (fourth bar), risk of side effects (fifth bar) and cost-labor efficacy (sixth bar) ranging from low (red) to high (green). APM: Antigen-presenting machinery; TAA: Tumor-associated antigens; TCR: T cell receptor; TSA: Tumor-specific antigen.
- Citation: Wagner S, Mullins CS, Linnebacher M. Colorectal cancer vaccines: Tumor-associated antigens vs neoantigens. World J Gastroenterol 2018; 24(48): 5418-5432
- URL: https://www.wjgnet.com/1007-9327/full/v24/i48/5418.htm
- DOI: https://dx.doi.org/10.3748/wjg.v24.i48.5418


