Copyright
©The Author(s) 2018.
World J Gastroenterol. Dec 21, 2018; 24(47): 5338-5350
Published online Dec 21, 2018. doi: 10.3748/wjg.v24.i47.5338
Published online Dec 21, 2018. doi: 10.3748/wjg.v24.i47.5338
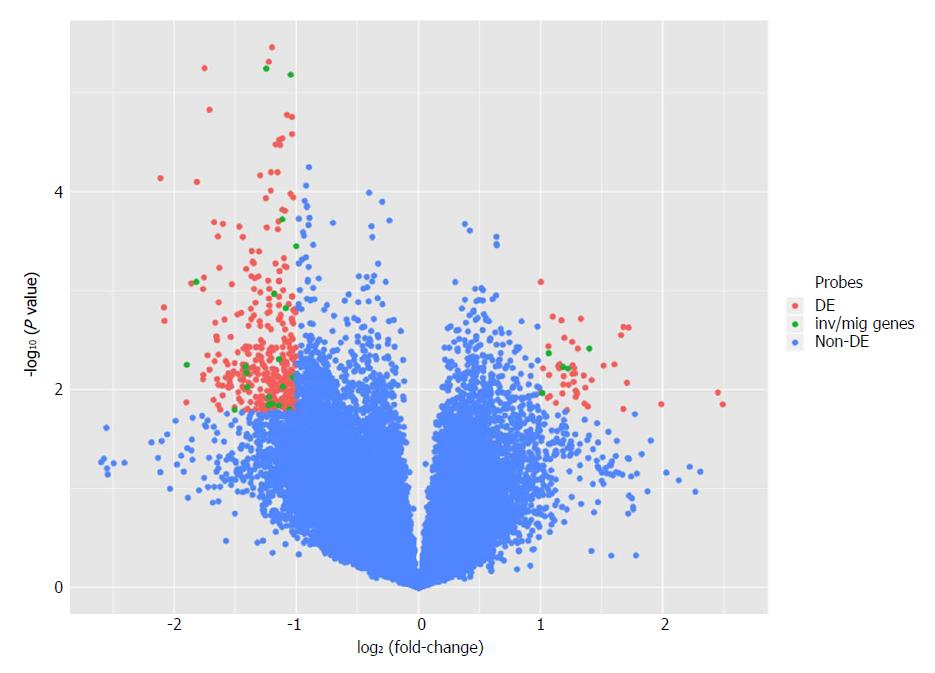
Figure 6 Volcano plot comparing gene expression after PIWIL1 permanent knockout in the gastric cancer AGP01 cell line.
Differentially expressed probes [adjusted P-value of < 0.05 and |Log2(Fold-Change)| > 1] are on superior left and right areas (red). mRNAs involved in invasion and migration processes are in green.
- Citation: Araújo T, Khayat A, Quintana L, Calcagno D, Mourão R, Modesto A, Paiva J, Lima A, Moreira F, Oliveira E, Souza M, Othman M, Liehr T, Abdelhay E, Gomes R, Santos S, Assumpção P. Piwi like RNA-mediated gene silencing 1 gene as a possible major player in gastric cancer. World J Gastroenterol 2018; 24(47): 5338-5350
- URL: https://www.wjgnet.com/1007-9327/full/v24/i47/5338.htm
- DOI: https://dx.doi.org/10.3748/wjg.v24.i47.5338


