Copyright
©The Author(s) 2018.
World J Gastroenterol. Dec 7, 2018; 24(45): 5131-5143
Published online Dec 7, 2018. doi: 10.3748/wjg.v24.i45.5131
Published online Dec 7, 2018. doi: 10.3748/wjg.v24.i45.5131
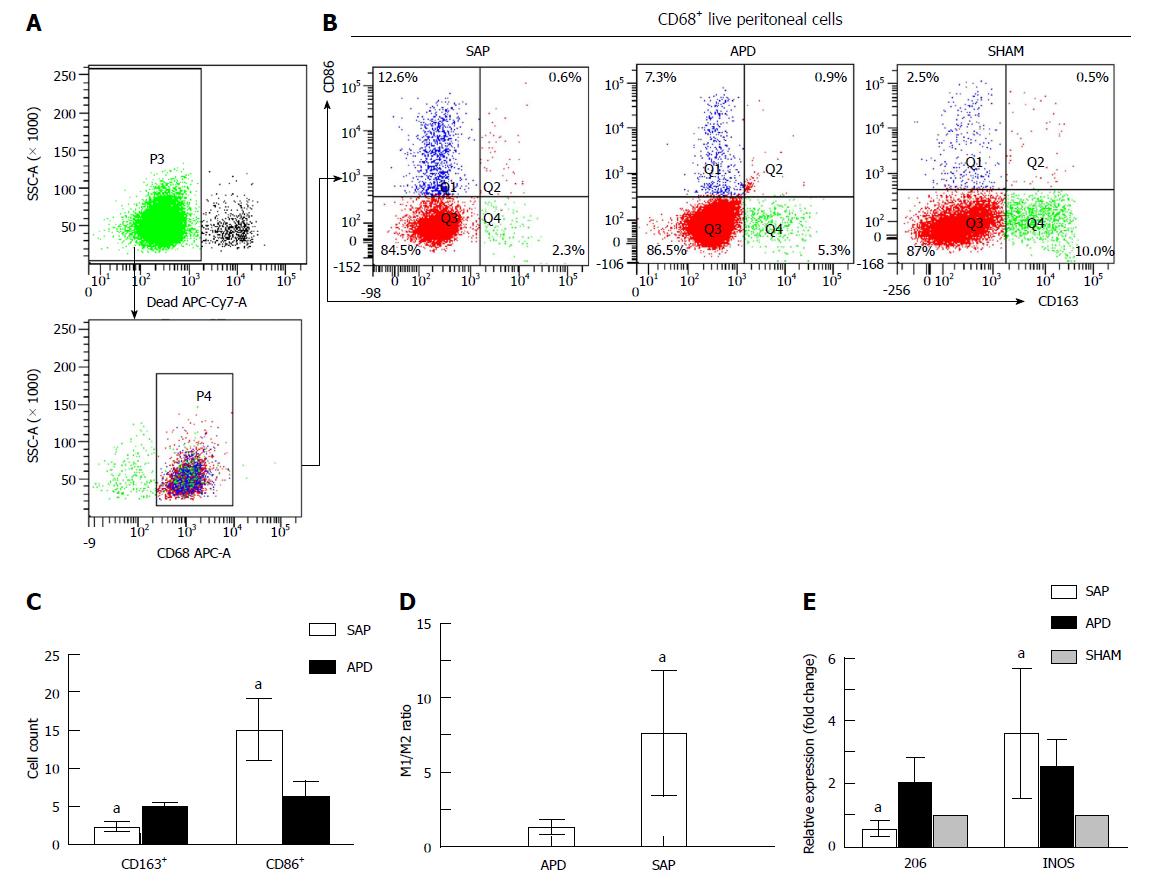
Figure 2 Different polarized phenotypes of peritoneal macrophages in each group.
A: Gating strategy for the peritoneal macrophage population; B-D: Representative dot plot (B) and the percentages (C) and M1/M2 ratio (D) of CD68+CD86+ (M1) cells and CD68+CD163+ (M2) cells in each group; E: Relative expression levels of CD206 and iNOS gene in peritoneal cells measured by real-time PCR and normalized to GAPDH mRNA. The data represent at least three independent experiments (A-B) or indicate the mean ± SD of six mice (E). aP < 0.05 vs abdominal paracentesis drainage.
- Citation: Liu RH, Wen Y, Sun HY, Liu CY, Zhang YF, Yang Y, Huang QL, Tang JJ, Huang CC, Tang LJ. Abdominal paracentesis drainage ameliorates severe acute pancreatitis in rats by regulating the polarization of peritoneal macrophages. World J Gastroenterol 2018; 24(45): 5131-5143
- URL: https://www.wjgnet.com/1007-9327/full/v24/i45/5131.htm
- DOI: https://dx.doi.org/10.3748/wjg.v24.i45.5131


