Copyright
©The Author(s) 2018.
World J Gastroenterol. Nov 28, 2018; 24(44): 5005-5012
Published online Nov 28, 2018. doi: 10.3748/wjg.v24.i44.5005
Published online Nov 28, 2018. doi: 10.3748/wjg.v24.i44.5005
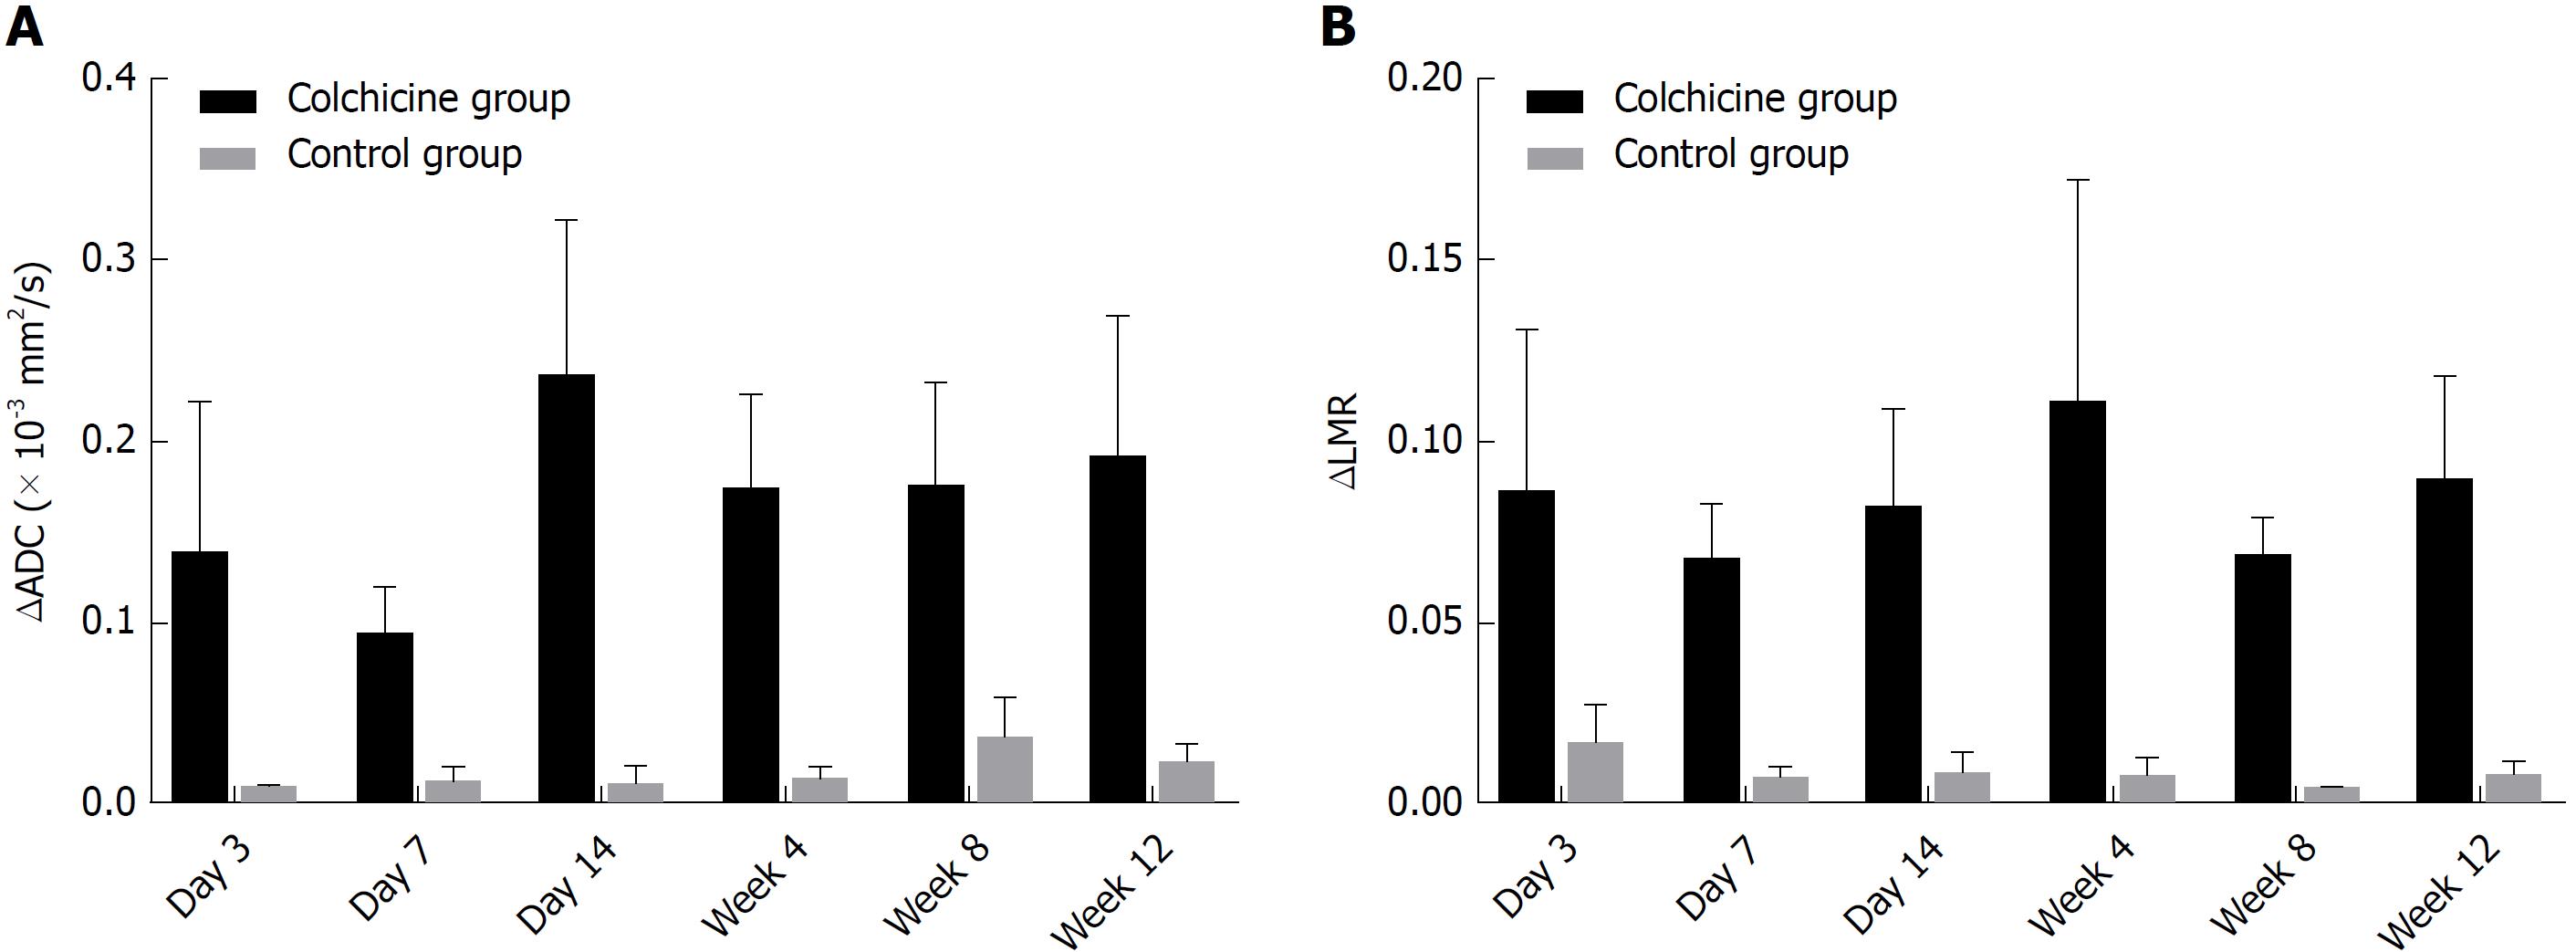
Figure 4 Comparisons of the difference of apparent diffusion coefficient (A) and the difference of liver-to-muscle ratio (B) between the colchicine group and the control group at each time point.
Data are expressed as mean ± standard deviation. A statistically significant difference was noted in ΔADC (A) and ΔLMR (B) between the colchicine group and the control group (P < 0.05). ADC: Apparent diffusion coefficient; LMR: Liver-to-muscle ratio.
- Citation: Zhang YY, Zhang CX, Li Y, Jiang X, Wang YF, Sun Y, Wang J, Ji WY, Liu Y. Development of a novel rat model of heterogeneous hepatic injury by injection with colchicine via the splenic vein. World J Gastroenterol 2018; 24(44): 5005-5012
- URL: https://www.wjgnet.com/1007-9327/full/v24/i44/5005.htm
- DOI: https://dx.doi.org/10.3748/wjg.v24.i44.5005


