Copyright
©The Author(s) 2018.
World J Gastroenterol. Nov 21, 2018; 24(43): 4906-4919
Published online Nov 21, 2018. doi: 10.3748/wjg.v24.i43.4906
Published online Nov 21, 2018. doi: 10.3748/wjg.v24.i43.4906
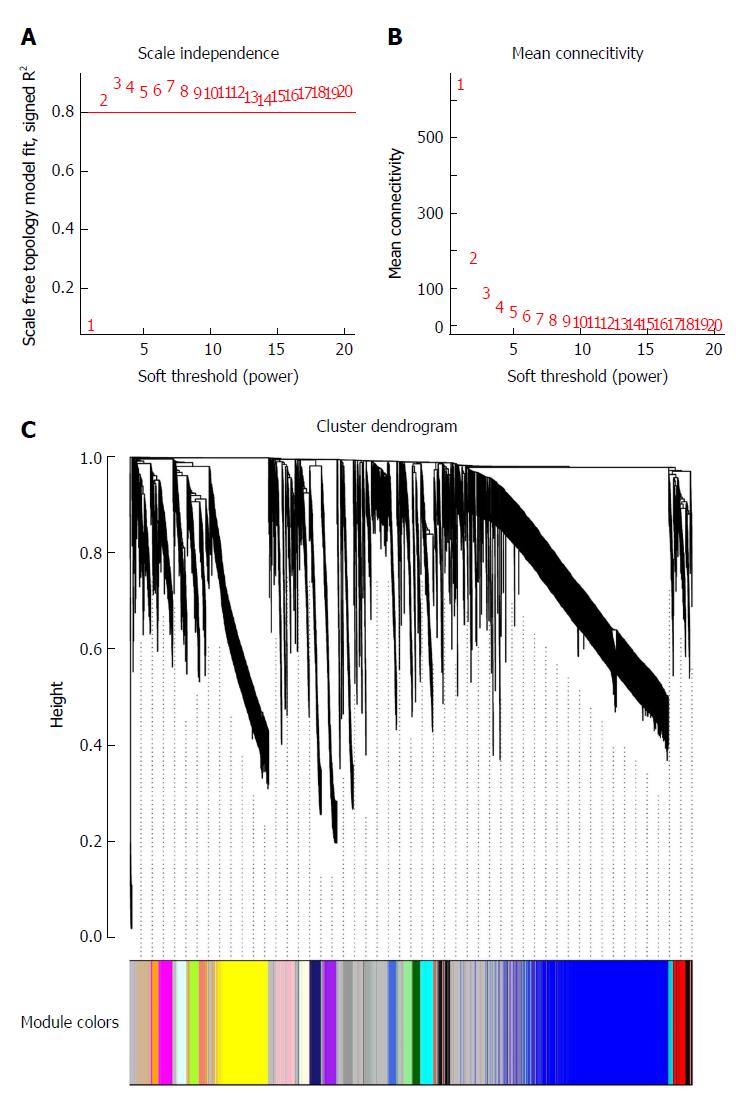
Figure 2 Determination of soft-thresholding power in weighted gene co-expression network analysis and gene clustering dendrograms.
A: Analysis of the scale-free fit index for various soft-thresholding powers (β); B: Analysis of the mean connectivity for various soft-thresholding powers; C: Gene clustering tree (dendrogram) obtained by hierarchical clustering of adjacency-based dissimilarity.
- Citation: Zhang J, Wu Y, Jin HY, Guo S, Dong Z, Zheng ZC, Wang Y, Zhao Y. Prognostic value of sorting nexin 10 weak expression in stomach adenocarcinoma revealed by weighted gene co-expression network analysis. World J Gastroenterol 2018; 24(43): 4906-4919
- URL: https://www.wjgnet.com/1007-9327/full/v24/i43/4906.htm
- DOI: https://dx.doi.org/10.3748/wjg.v24.i43.4906


