
















©The Author(s) 2018.
World J Gastroenterol. Jan 28, 2018; 24(4): 461-474
Published online Jan 28, 2018. doi: 10.3748/wjg.v24.i4.461
Published online Jan 28, 2018. doi: 10.3748/wjg.v24.i4.461
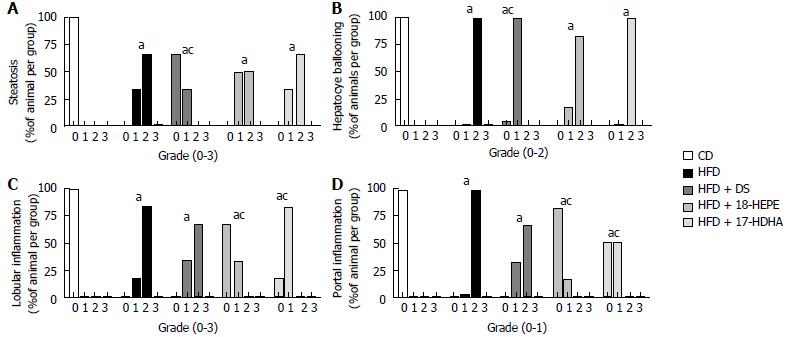
Figure 7 NAS score.
(A) Steatosis, (B) hepatocyte ballooning, (C) lobular and (D) portal inflammation. Bars represent the percentage of animals in the group at the given score. According to NAS, steatosis was graded 0-3, hepatocyte ballooning 0-2, lobular inflammation 0-3, and portal inflammation (0-2). Groups: CD (n = 6), HFD (n = 6), HFD + DS (n = 6), HFD + 18-HEPE (n = 6), HFD+17-HDHA (n = 6). aP < 0.05 vs CD, cP < 0.05 vs HFD by Fisher’s exact test.
- Citation: Rodriguez-Echevarria R, Macias-Barragan J, Parra-Vargas M, Davila-Rodriguez JR, Amezcua-Galvez E, Armendariz-Borunda J. Diet switch and omega-3 hydroxy-fatty acids display differential hepatoprotective effects in an obesity/nonalcoholic fatty liver disease model in mice. World J Gastroenterol 2018; 24(4): 461-474
- URL: https://www.wjgnet.com/1007-9327/full/v24/i4/461.htm
- DOI: https://dx.doi.org/10.3748/wjg.v24.i4.461