Copyright
©The Author(s) 2018.
World J Gastroenterol. Oct 21, 2018; 24(39): 4472-4481
Published online Oct 21, 2018. doi: 10.3748/wjg.v24.i39.4472
Published online Oct 21, 2018. doi: 10.3748/wjg.v24.i39.4472
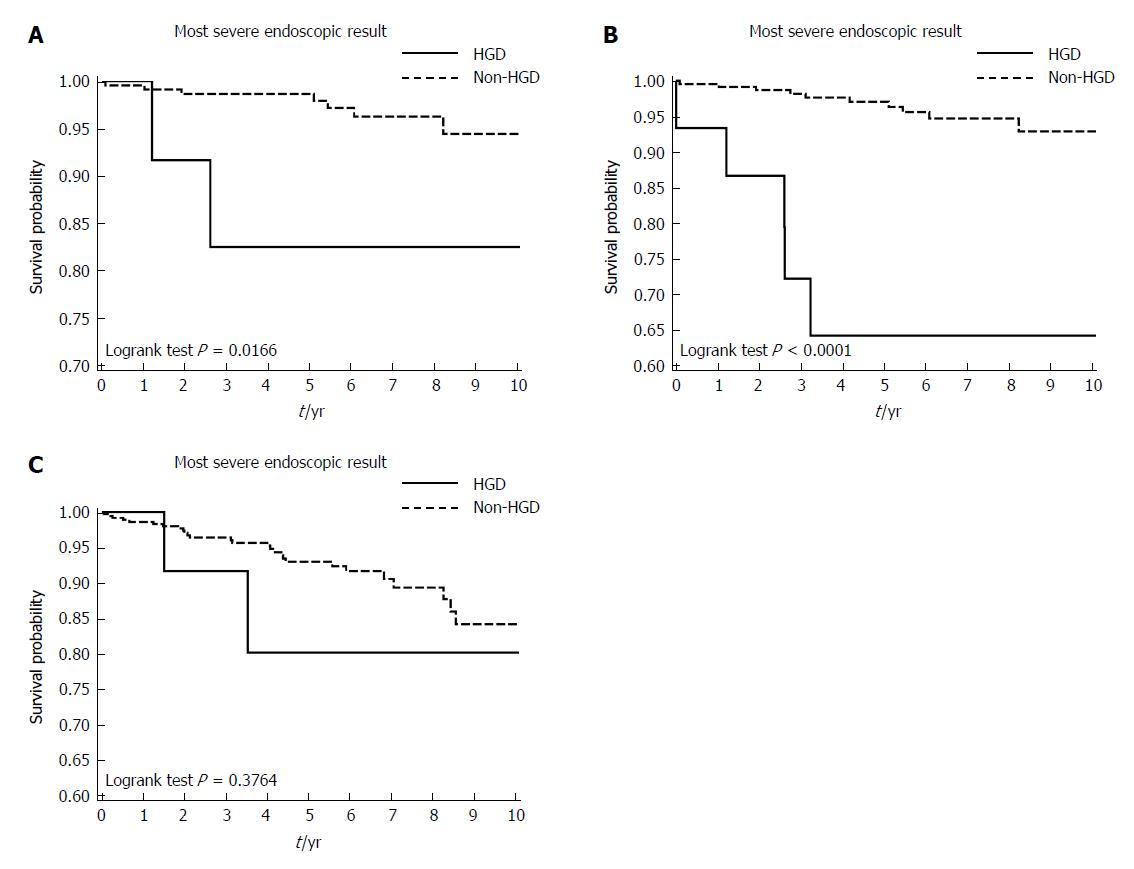
Figure 2 Kaplan Meier curves by high-grade dysplasia vs low grade or without dysplasia groups.
A: Non-Barrett’s esophagus (BE) cancer free survival, n = 239; B: Any cancer (BE and non-BE cancers) free survival, n = 245; C: All-cause mortality, n = 245. BE: Barrett’s esophagus; HGD: High grade dysplasia; Non-HGD: Low grade or without dysplasia.
- Citation: Bar N, Schwartz N, Nissim M, Fliss-Isacov N, Zelber-Sagi S, Kariv R. Barrett’s esophagus with high grade dysplasia is associated with non-esophageal cancer. World J Gastroenterol 2018; 24(39): 4472-4481
- URL: https://www.wjgnet.com/1007-9327/full/v24/i39/4472.htm
- DOI: https://dx.doi.org/10.3748/wjg.v24.i39.4472


