Copyright
©The Author(s) 2018.
World J Gastroenterol. Oct 14, 2018; 24(38): 4341-4355
Published online Oct 14, 2018. doi: 10.3748/wjg.v24.i38.4341
Published online Oct 14, 2018. doi: 10.3748/wjg.v24.i38.4341
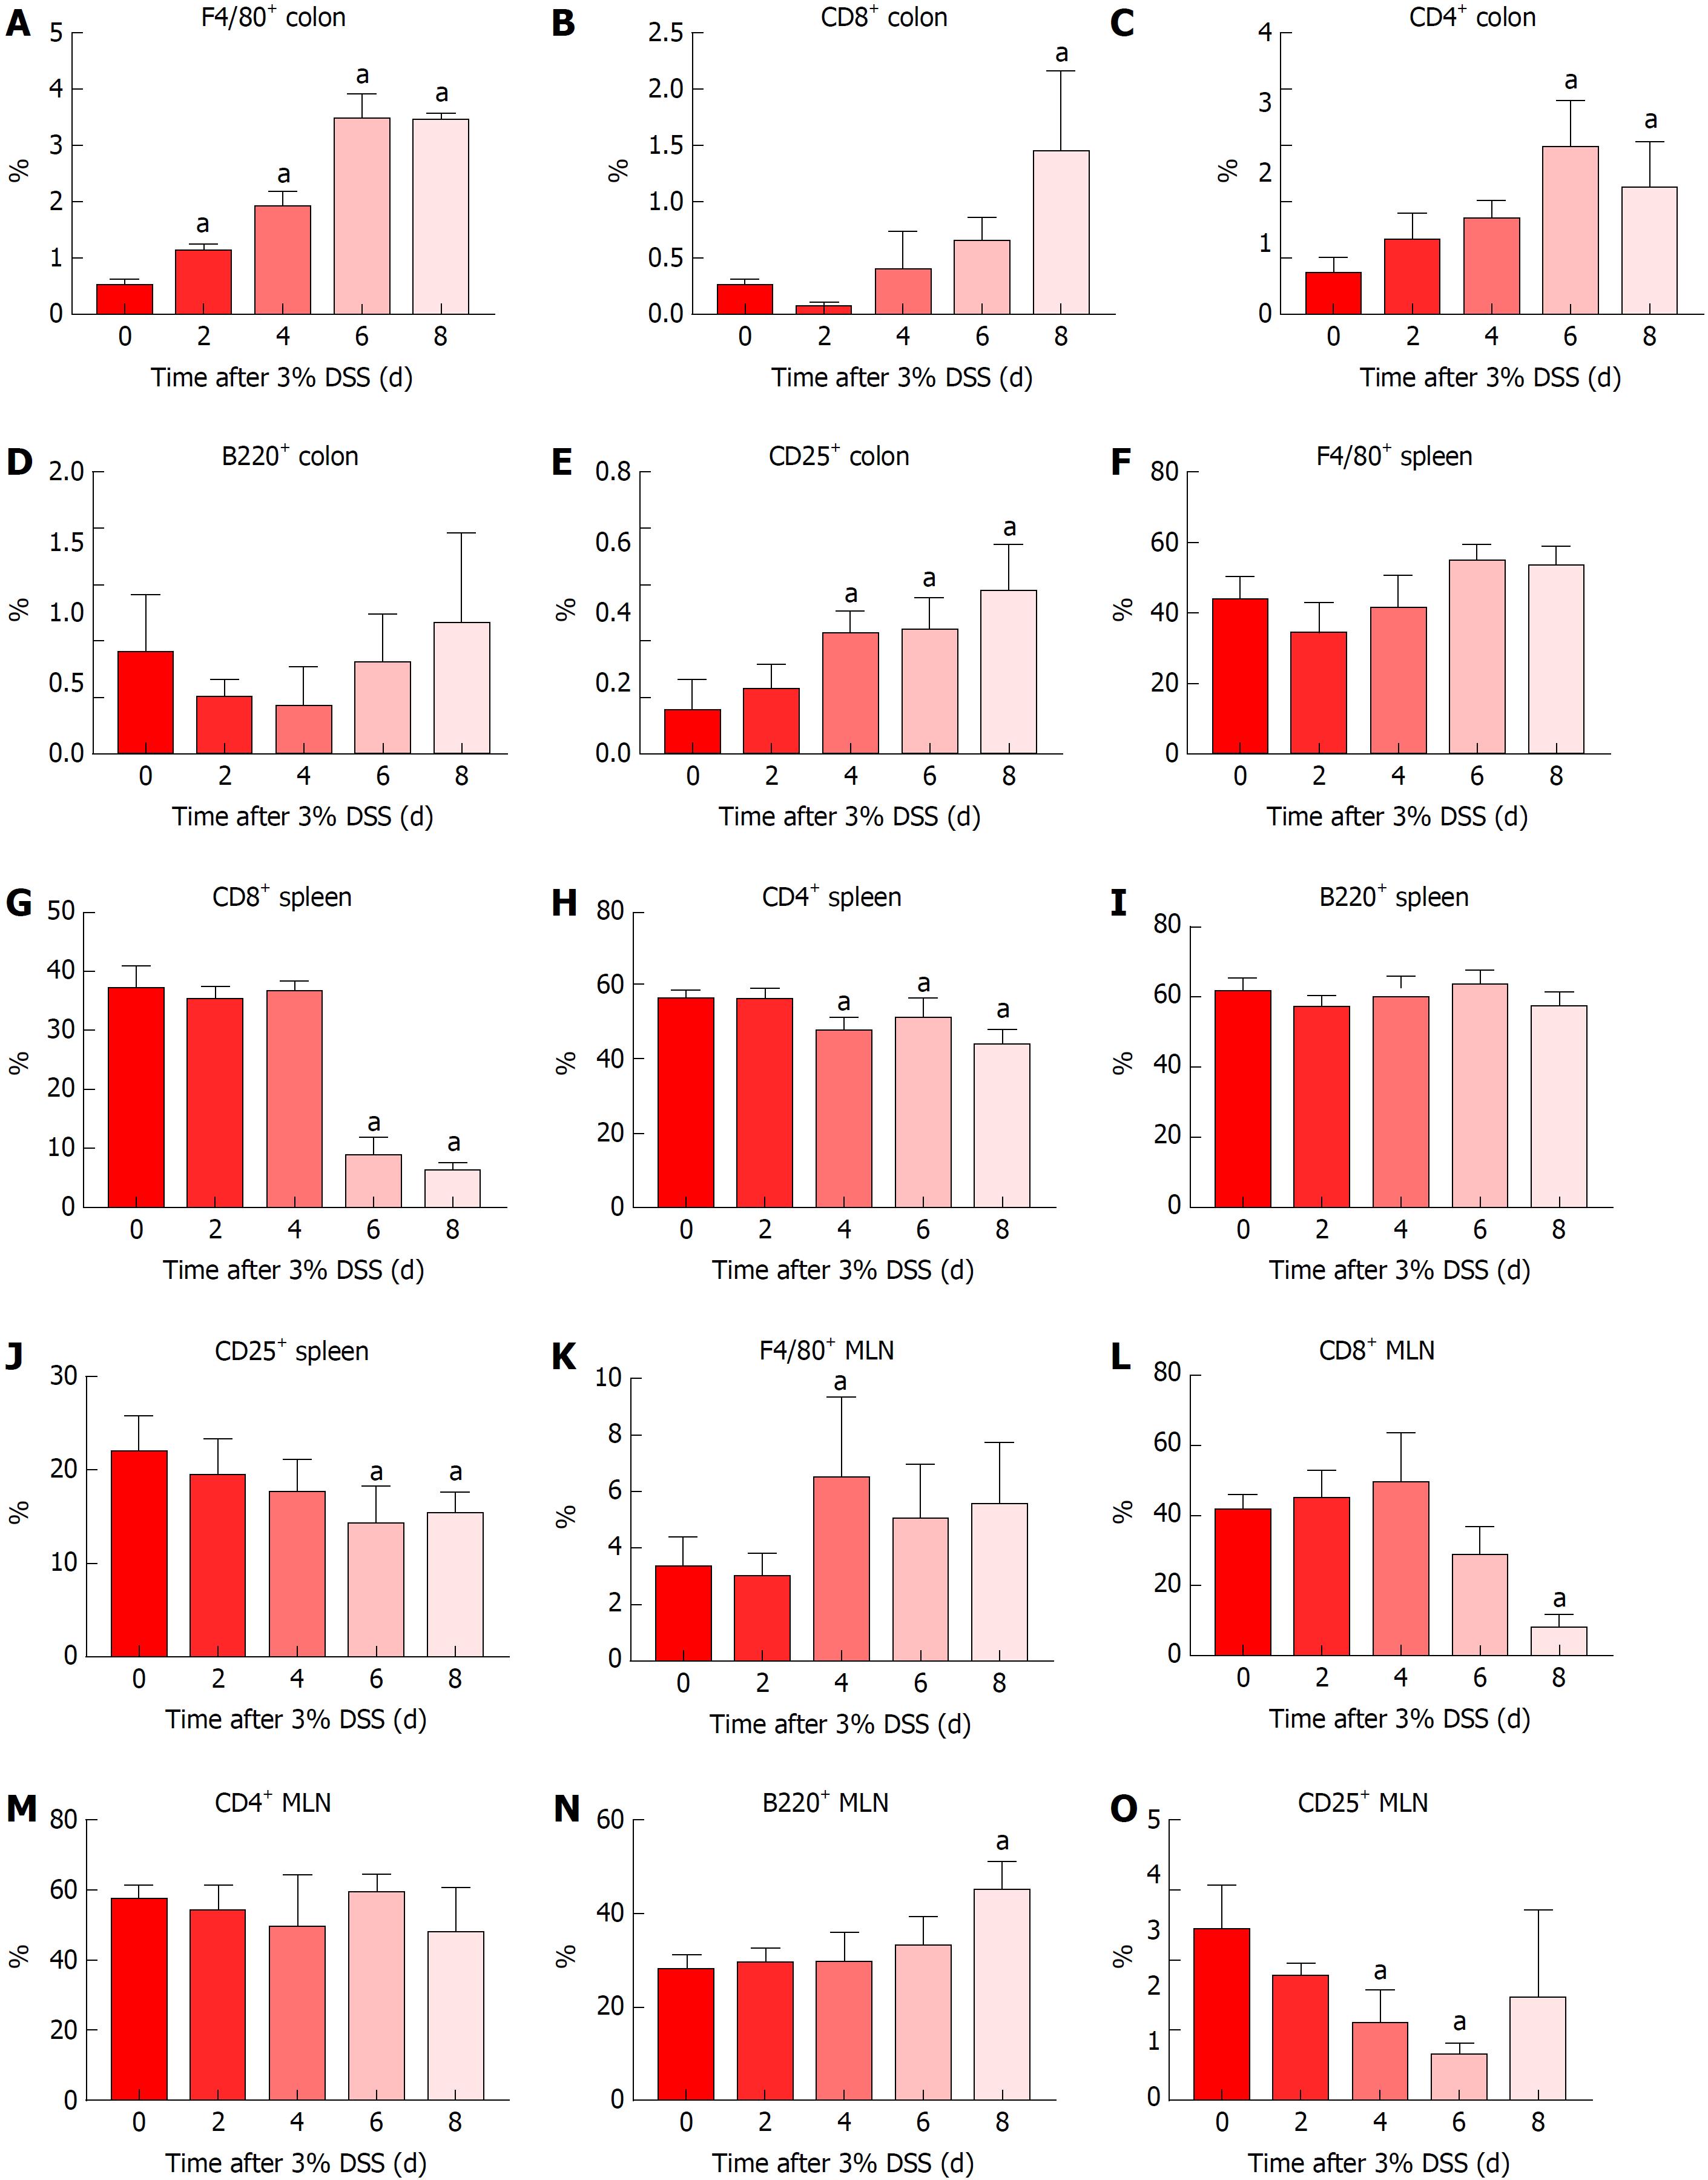
Figure 5 Immune cell profile in the colon, spleen and mesenteric lymph nodes of 3% dextran sulfate sodium animals.
Tissue samples were collected at different time points and IHC or flow cytometry were performed for temporal analysis of immune cells’ profile. Results showed progressive increased presence of colonic (A) F4/80+ macrophages, (B) CD8+ Tcyt cells, (C) CD4+ Th cells and (E) CD25+ Treg cells and no change in (D) B220+ B cells. There was no difference in splenic (F) F4/80+ macrophages and (I) B220+ B cells, however, there was a decrease in (G) CD8+ Tcyt cells, (H) CD4+ Th cells and (J) CD25+ Treg cells starting at day 4. MLN analysis resulted in decreased levels of (L) CD8+ Tcyt cells and (O) CD25+ Treg cells, along with a slight increase of (K) F4/80+ macrophages at day 4, (N) B220+ B cells at day 8 and no changes in (M) CD4+ Th cells. One-way ANOVA followed by Dunnett post-hoc test. aP < 0.05 compared to control (day 0). n = 4/each time point analyzed through IHC (All colon samples and MLN F4/80+ and CD25+). n = 6/each time point analyzed through flow cytometry (All spleen samples and MLN CD8+, CD4+ and B220+). MLN: Mesenteric lymph nodes; DSS: Dextran sulfate sodium.
- Citation: Nunes NS, Kim S, Sundby M, Chandran P, Burks SR, Paz AH, Frank JA. Temporal clinical, proteomic, histological and cellular immune responses of dextran sulfate sodium-induced acute colitis. World J Gastroenterol 2018; 24(38): 4341-4355
- URL: https://www.wjgnet.com/1007-9327/full/v24/i38/4341.htm
- DOI: https://dx.doi.org/10.3748/wjg.v24.i38.4341


