Copyright
©The Author(s) 2018.
World J Gastroenterol. Oct 14, 2018; 24(38): 4341-4355
Published online Oct 14, 2018. doi: 10.3748/wjg.v24.i38.4341
Published online Oct 14, 2018. doi: 10.3748/wjg.v24.i38.4341
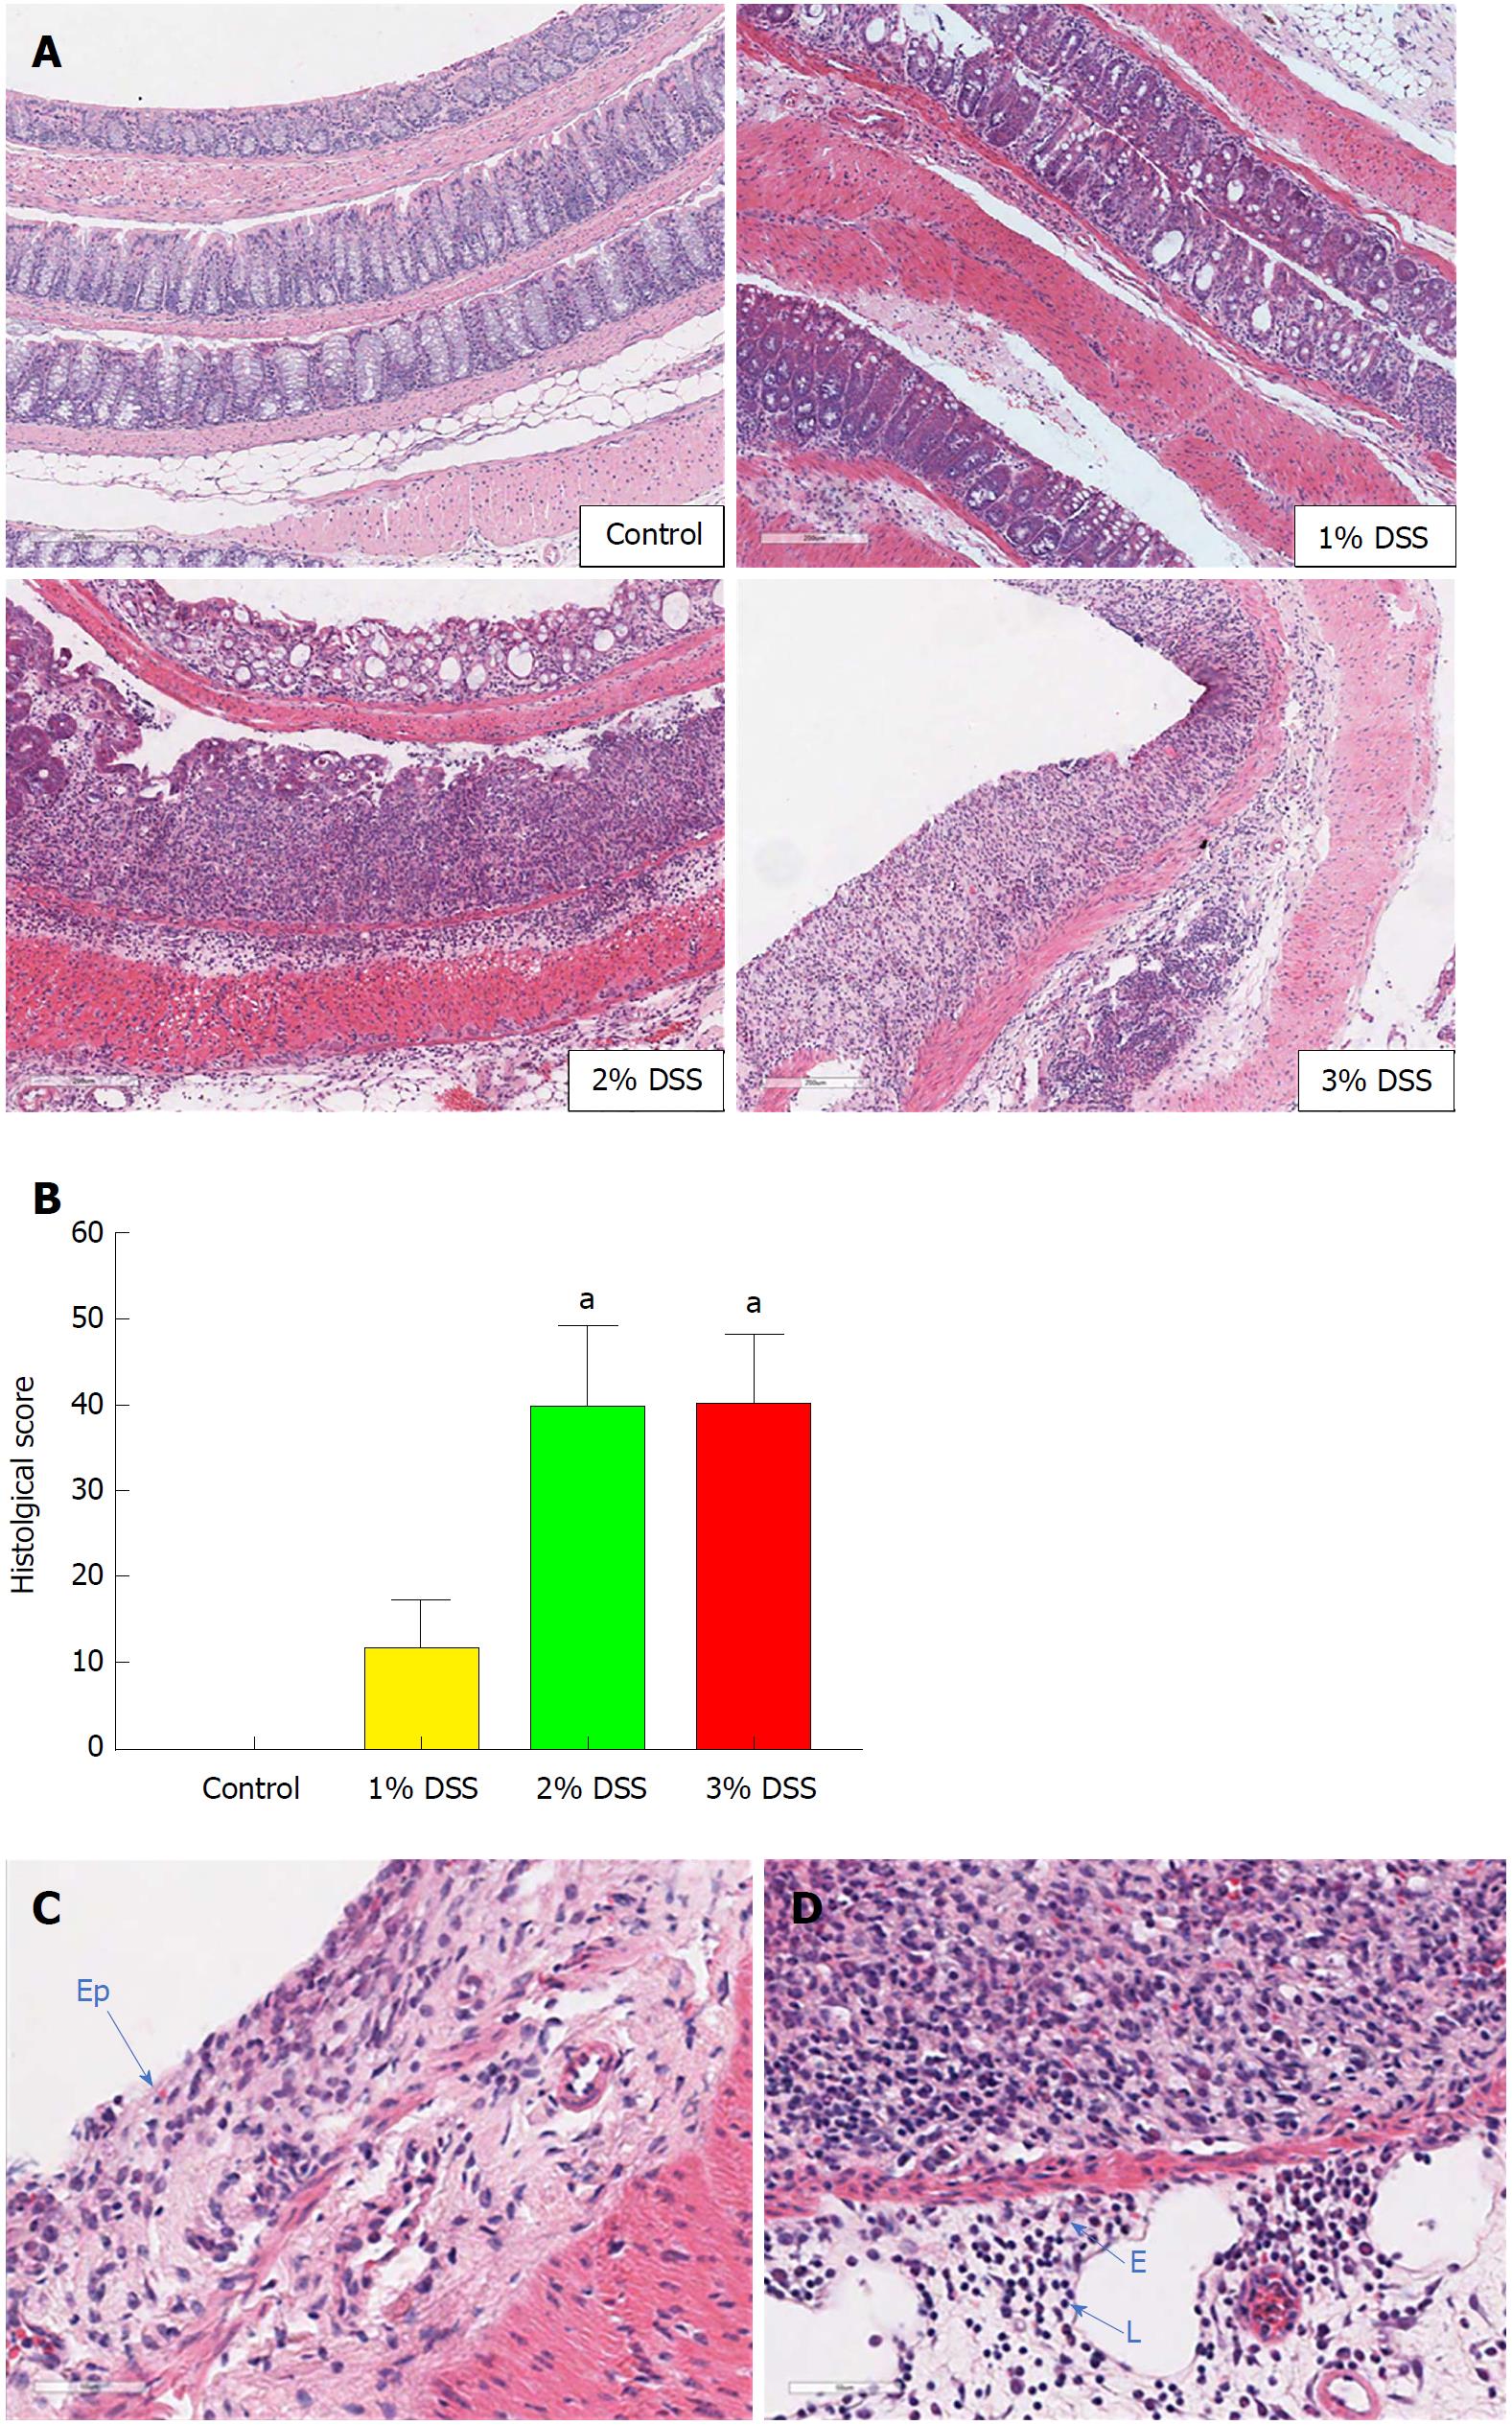
Figure 2 Histological comparisons between 1%, 2% and 3% dextran sulfate sodium.
At the end of 8 d, the difference between DSS concentration was visible in (A) colonic damage (crypt depletion, inflammation, loss of epithelial barrier) compared to control. (B) Histological scores were similar between 2% and 3% DSS, where at the end of 8 d it is possible to visualize (C) the loss of the Ep and (D) infiltration of eosinophils (E) and lymphocytes (L). One-way ANOVA followed by Dunnet post-hoc test. aP < 0.05 compared to control. n = 4/DSS group. DSS: Dextran sulfate sodium; Ep: Epithelial layer.
- Citation: Nunes NS, Kim S, Sundby M, Chandran P, Burks SR, Paz AH, Frank JA. Temporal clinical, proteomic, histological and cellular immune responses of dextran sulfate sodium-induced acute colitis. World J Gastroenterol 2018; 24(38): 4341-4355
- URL: https://www.wjgnet.com/1007-9327/full/v24/i38/4341.htm
- DOI: https://dx.doi.org/10.3748/wjg.v24.i38.4341


