Copyright
©The Author(s) 2018.
World J Gastroenterol. Sep 28, 2018; 24(36): 4197-4207
Published online Sep 28, 2018. doi: 10.3748/wjg.v24.i36.4197
Published online Sep 28, 2018. doi: 10.3748/wjg.v24.i36.4197
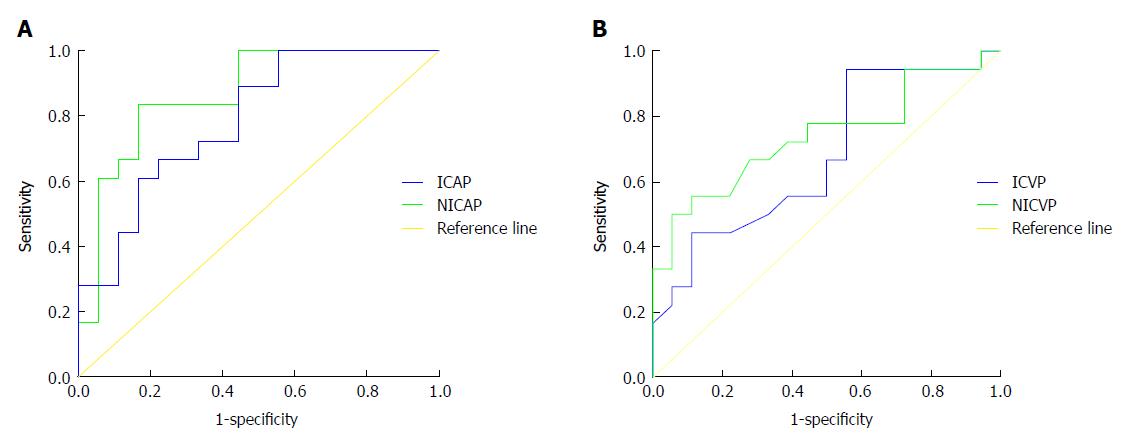
Figure 5 Receiver operating characteristic curves.
Graphs showing the sensitivity and specificity of both iodine concentration and normalized iodine concentration of adipose tissue in the triangular area in front of the vertebral body during the arterial phase and the venous phase for differential diagnosis of T3 and T4 stages. AP: Arterial phase; VP: Venous phase; IC: Iodine concentration; NIC: Normalized iodine concentration.
- Citation: Zhou Y, Liu D, Hou P, Zha KJ, Wang F, Zhou K, He W, Gao JB. Low-dose spectral insufflation computed tomography protocol preoperatively optimized for T stage esophageal cancer - preliminary research experience. World J Gastroenterol 2018; 24(36): 4197-4207
- URL: https://www.wjgnet.com/1007-9327/full/v24/i36/4197.htm
- DOI: https://dx.doi.org/10.3748/wjg.v24.i36.4197


