Copyright
©The Author(s) 2018.
World J Gastroenterol. Sep 14, 2018; 24(34): 3898-3907
Published online Sep 14, 2018. doi: 10.3748/wjg.v24.i34.3898
Published online Sep 14, 2018. doi: 10.3748/wjg.v24.i34.3898
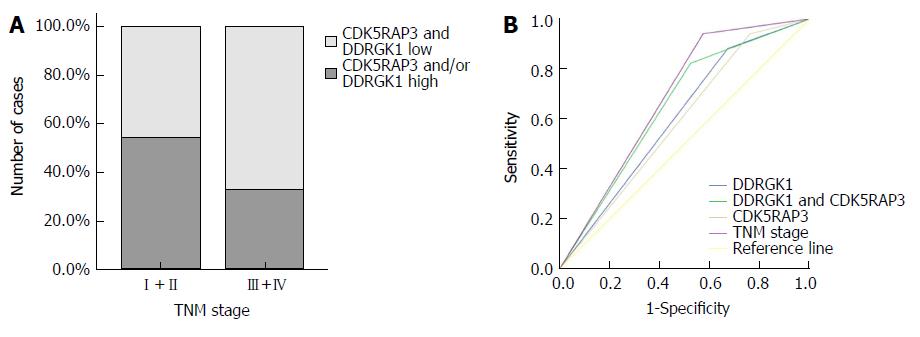
Figure 4 Receiver operating characteristic analysis of the sensitivity and specificity of the predictive value of DDRGK1 expression model, CDK5RAP3 expression model, the combined CDK5RAP3 and DDRGK1 model and the TNM model.
A: Co-expression of CDK5RAP3 and DDRGK1 were significantly correlated with TNM stage. B: The area under the ROC curve was 0.649 (0.548-0.751) for the co-expression of CDK5RAP3 and DDRGK1 model, 0.598 (0.486-0.693) for the CDK5RAP3 expression model, 0.605 (0.501-0.708) for the DDRGK1 expression model, and 0.659 (0.562-0.756) for the TNM model.
- Citation: Lin JX, Xie XS, Weng XF, Zheng CH, Xie JW, Wang JB, Lu J, Chen QY, Cao LL, Lin M, Tu RH, Li P, Huang CM. Low expression of CDK5RAP3 and DDRGK1 indicates a poor prognosis in patients with gastric cancer. World J Gastroenterol 2018; 24(34): 3898-3907
- URL: https://www.wjgnet.com/1007-9327/full/v24/i34/3898.htm
- DOI: https://dx.doi.org/10.3748/wjg.v24.i34.3898


