Copyright
©The Author(s) 2018.
World J Gastroenterol. Sep 14, 2018; 24(34): 3871-3883
Published online Sep 14, 2018. doi: 10.3748/wjg.v24.i34.3871
Published online Sep 14, 2018. doi: 10.3748/wjg.v24.i34.3871
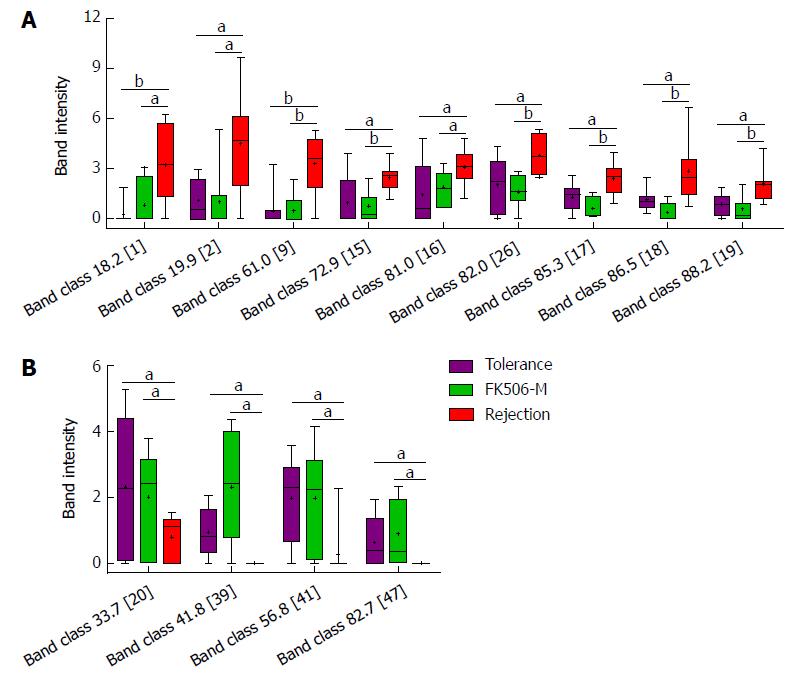
Figure 5 Identification of crucial bands of gut microbial changes induced by middle dosage tacrolimus treatment.
A: Compared to the rejection group, the intensities of nine band classes including 18.2 (band 1), 19.9 (band 2), 61.0 (band 9), 72.9 (band 15), 81.0 (band 16), 82.0 (band 26), 85.3 (band 17), 86.5 (band 18), and 88.2 (band 19), were significantly decreased in the FK506-M-treated and tolerance groups; B: Compared with the rejection group, four band classes, including 33.7 (band 20), 41.8 (band 39), 56.8 (band 41), and 82.7 (band 47), showed increased intensities in the FK506-M-treated and tolerance groups. aP < 0.05, bP < 0.01.
- Citation: Jiang JW, Ren ZG, Lu HF, Zhang H, Li A, Cui GY, Jia JJ, Xie HY, Chen XH, He Y, Jiang L, Li LJ. Optimal immunosuppressor induces stable gut microbiota after liver transplantation. World J Gastroenterol 2018; 24(34): 3871-3883
- URL: https://www.wjgnet.com/1007-9327/full/v24/i34/3871.htm
- DOI: https://dx.doi.org/10.3748/wjg.v24.i34.3871


