Copyright
©The Author(s) 2018.
World J Gastroenterol. Aug 28, 2018; 24(32): 3650-3662
Published online Aug 28, 2018. doi: 10.3748/wjg.v24.i32.3650
Published online Aug 28, 2018. doi: 10.3748/wjg.v24.i32.3650
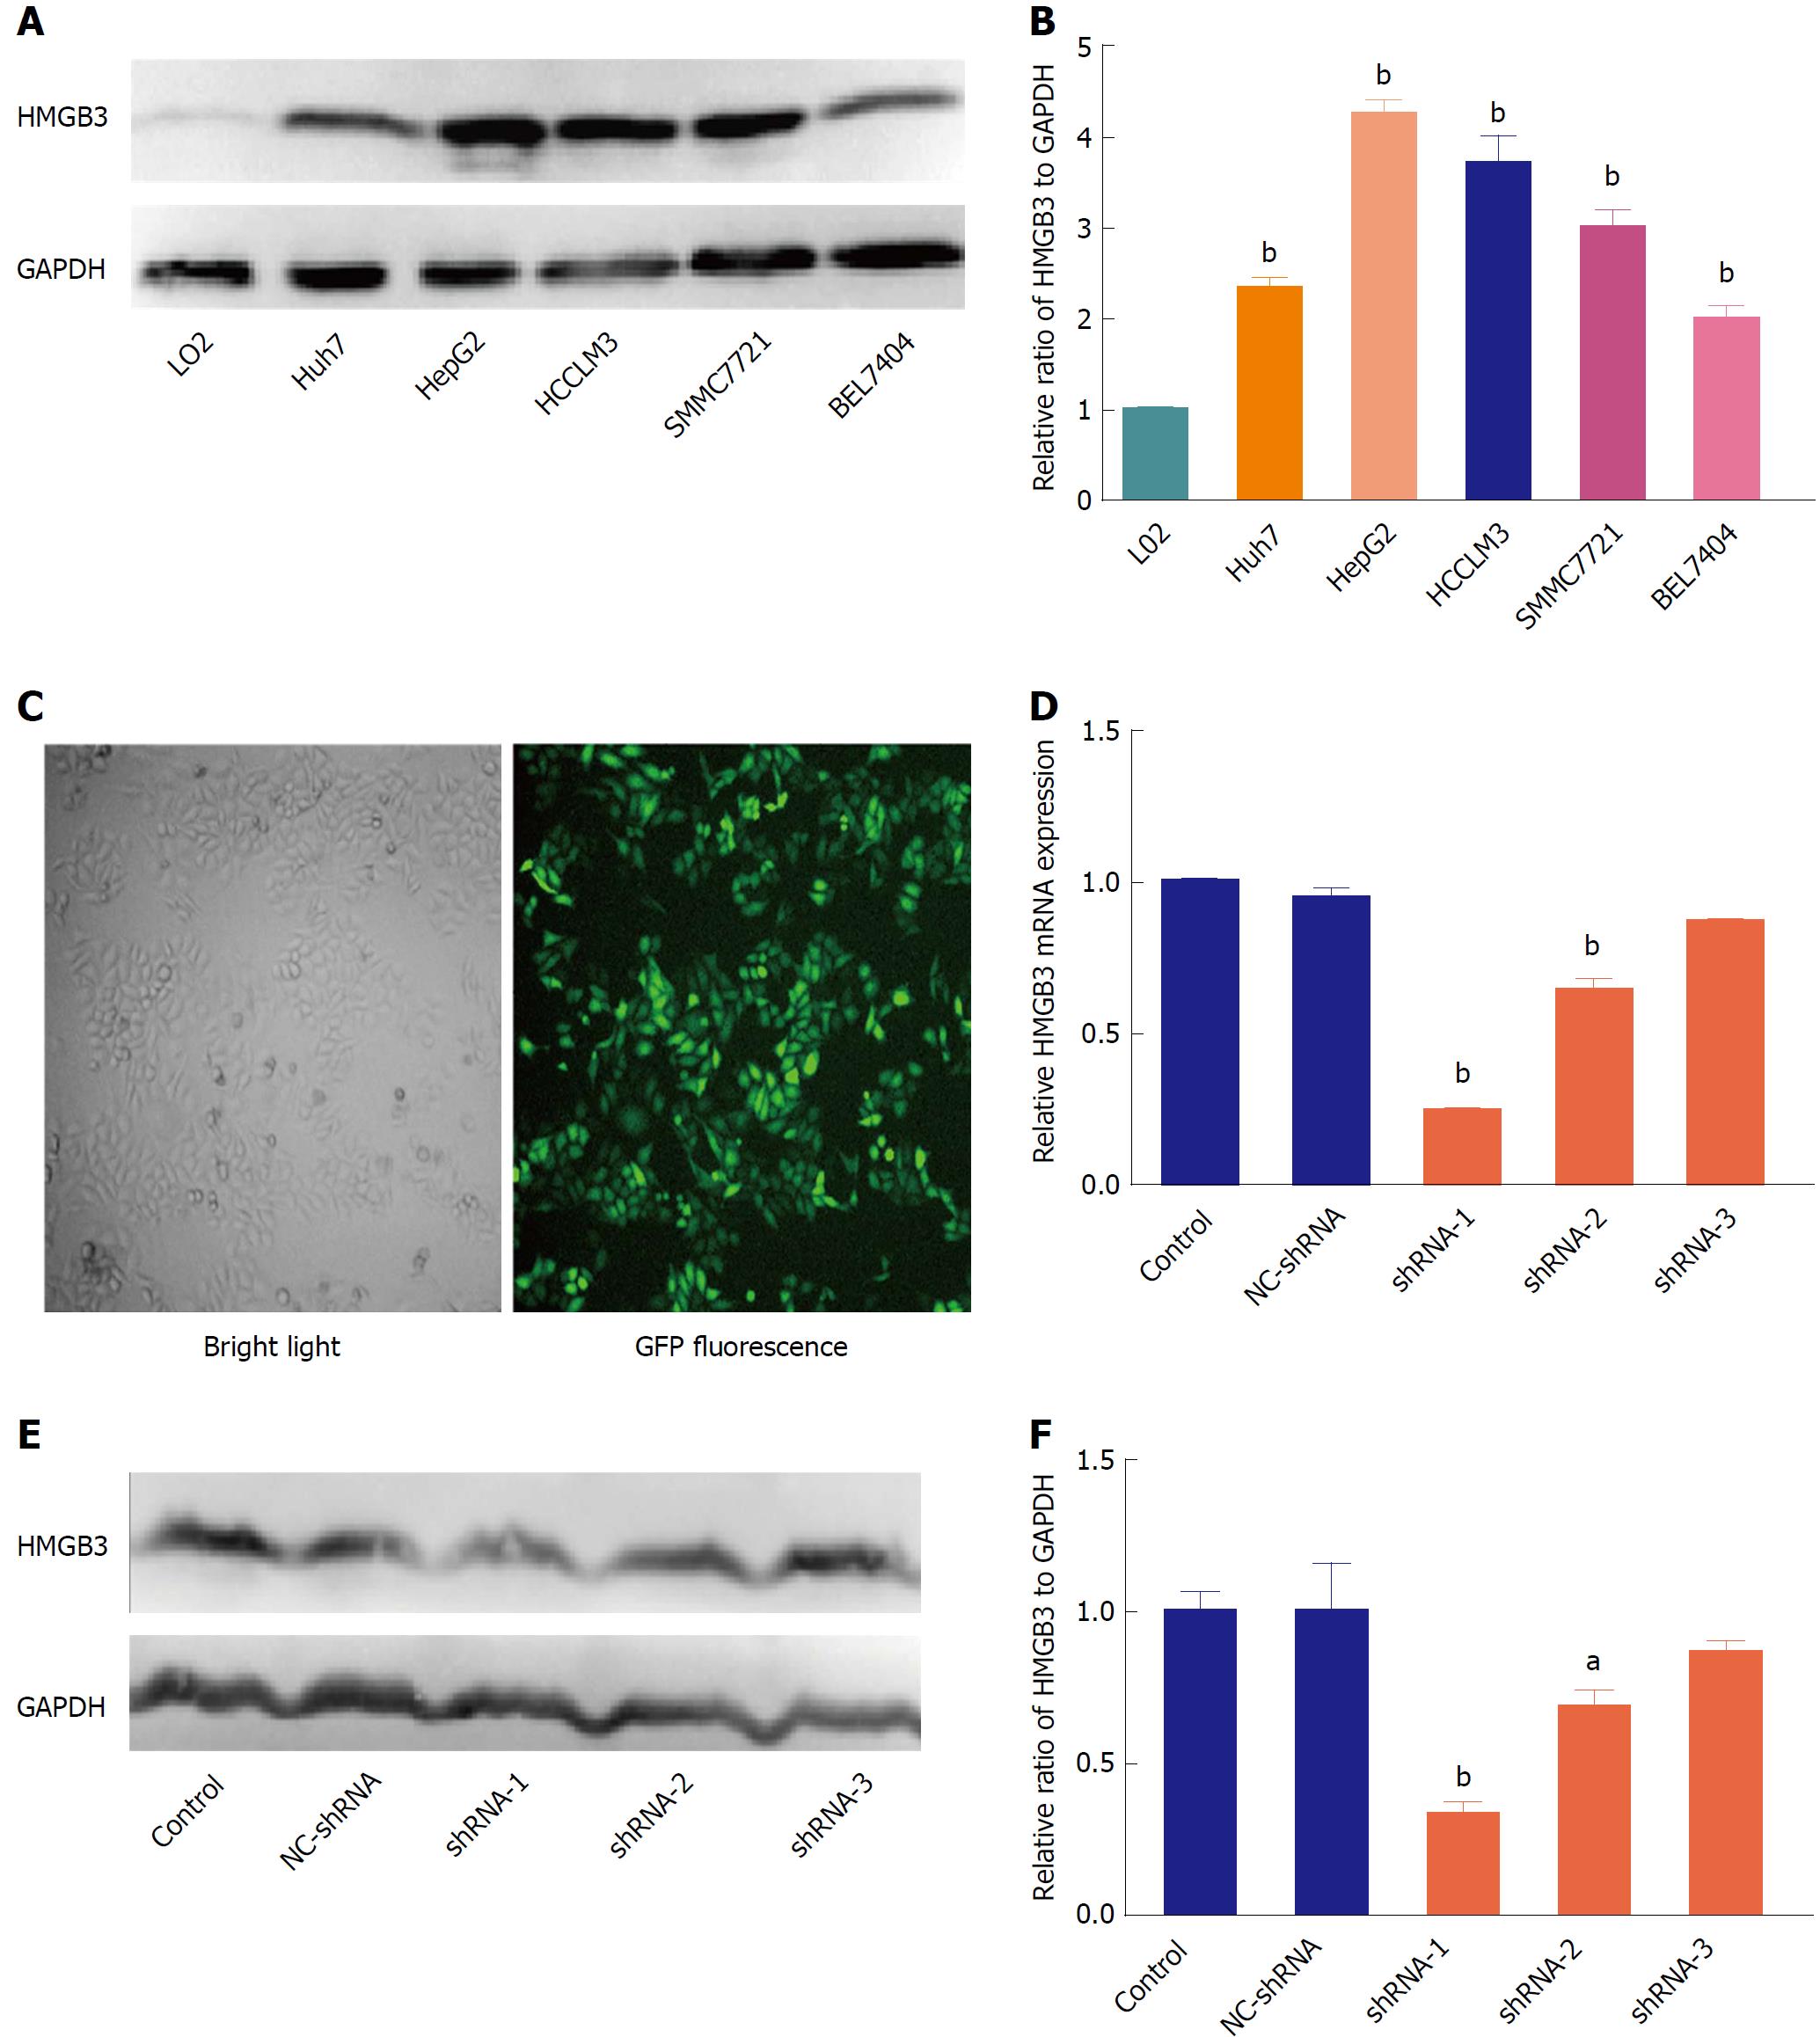
Figure 3 Silencing HMGB3 in hepatocellular carcinoma cell lines.
A: The protein expression of HMGB3 was detected in different HCC cell lines (Huh7, HepG2, HCCLM3, SMMC7721, and BEL7404), and normal hepatocytes L02 using western blotting. GAPDH was used as an internal reference. B: Each bar represents the corresponding intensity in A normalized to GAPDH. C: Representative morphology of HepG2 cells transfected with GFP-labeling shRNA in bright light and fluorescence. D: RT-qPCR was performed to detect HMGB3 mRNA levels in HepG2 cells transfected with different shRNAs and control. Relative value of HMGB3 was calculated according to the 2−ΔΔCt method. E: Western blotting was conducted to analyze the HMGB3 protein expression in cells of the shRNA-transfected group and control group. F: Each bar represents the corresponding intensity in E normalized to GAPDH. aP < 0.05; bP < 0.01.
- Citation: Zheng WJ, Yao M, Fang M, Wang L, Dong ZZ, Yao DF. Abnormal expression of HMGB-3 is significantly associated with malignant transformation of hepatocytes. World J Gastroenterol 2018; 24(32): 3650-3662
- URL: https://www.wjgnet.com/1007-9327/full/v24/i32/3650.htm
- DOI: https://dx.doi.org/10.3748/wjg.v24.i32.3650


