Copyright
©The Author(s) 2018.
World J Gastroenterol. Aug 14, 2018; 24(30): 3398-3413
Published online Aug 14, 2018. doi: 10.3748/wjg.v24.i30.3398
Published online Aug 14, 2018. doi: 10.3748/wjg.v24.i30.3398
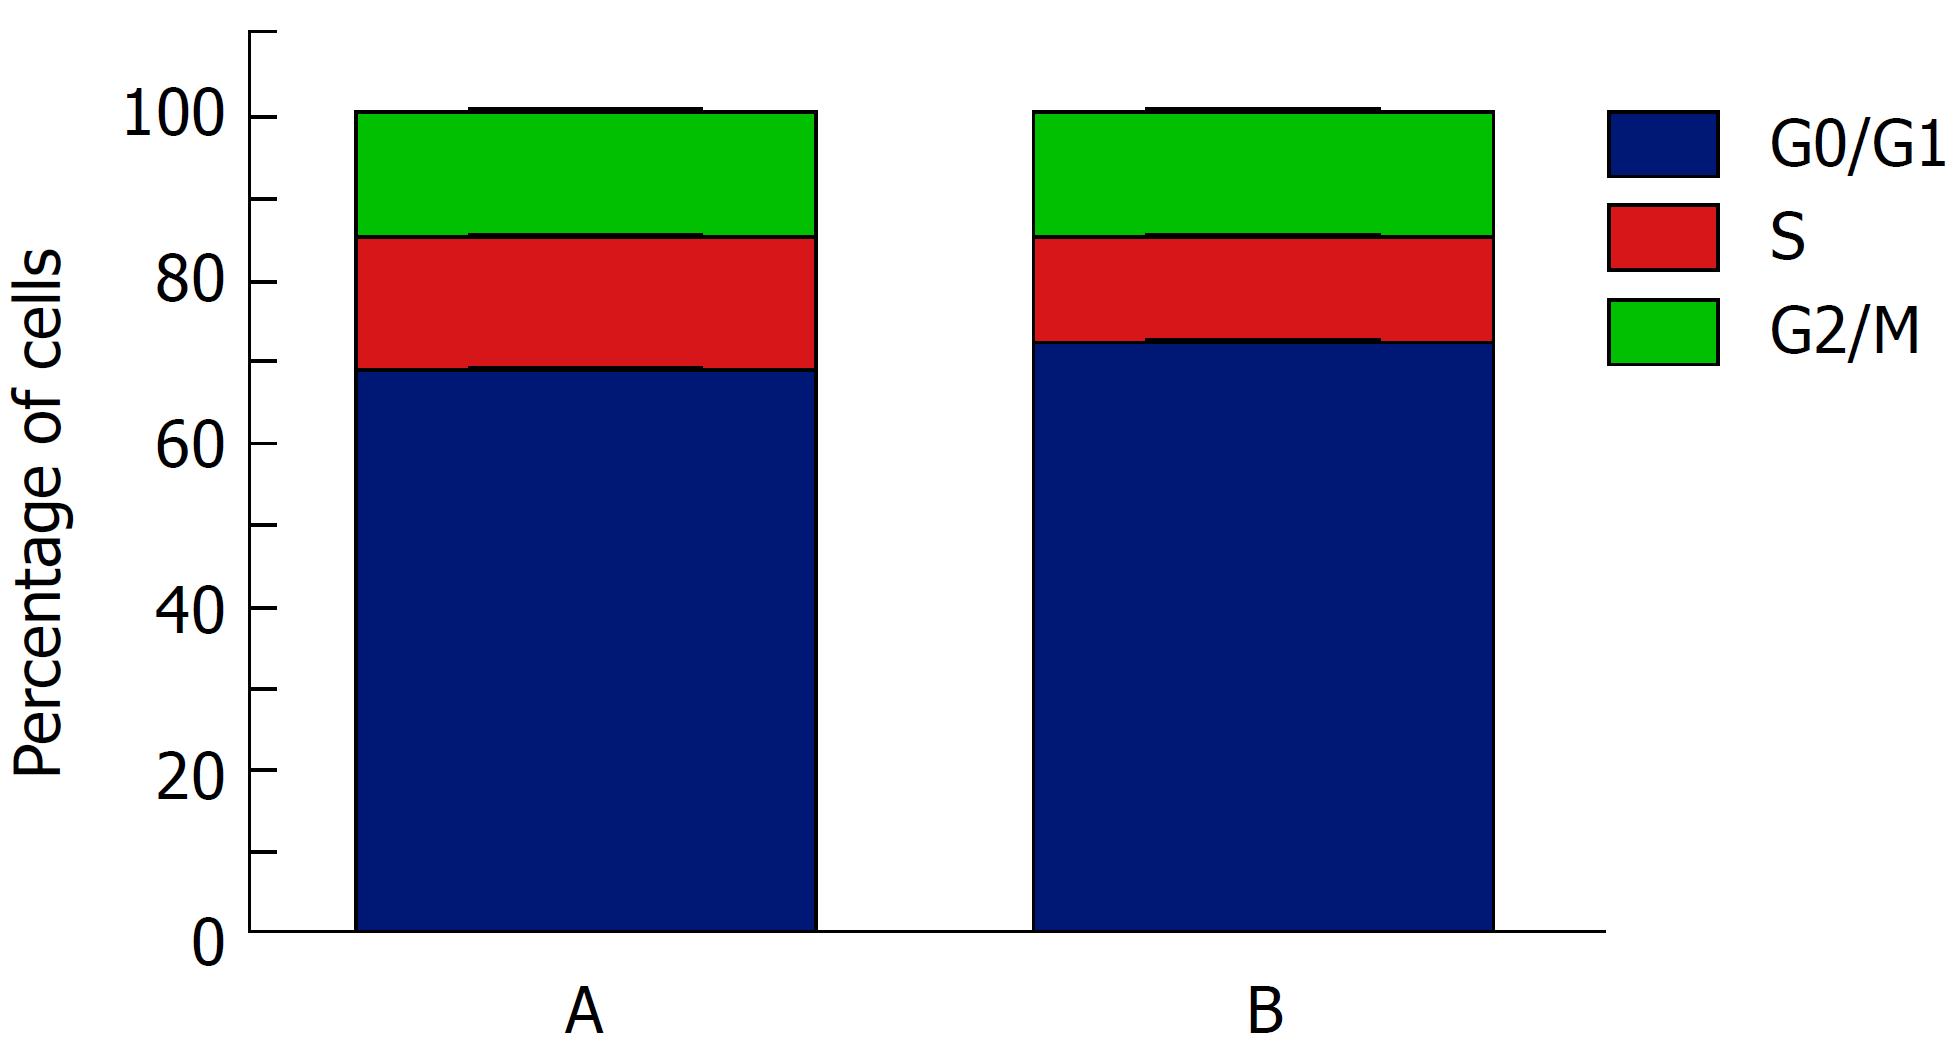
Figure 6 Cell cycle distribution of each group.
(group A) Serum-free medium containing 2 mg/mL sericin and (group B) serum-free medium without sericin. Data are expressed as mean ± SD (n = 3). The portion of cells in S phase in group A (16.21% ± 0.98%) was significantly higher than that in group B (12.61% ± 0.90%) (P = 0.009).
- Citation: Huang Y, Peng Q, Li HY, Jia ZD, Li Y, Gao Y. Novel sericin-based hepatocyte serum-free medium and sericin’s effect on hepatocyte transcriptome. World J Gastroenterol 2018; 24(30): 3398-3413
- URL: https://www.wjgnet.com/1007-9327/full/v24/i30/3398.htm
- DOI: https://dx.doi.org/10.3748/wjg.v24.i30.3398


