Copyright
©The Author(s) 2018.
World J Gastroenterol. Aug 7, 2018; 24(29): 3281-3292
Published online Aug 7, 2018. doi: 10.3748/wjg.v24.i29.3281
Published online Aug 7, 2018. doi: 10.3748/wjg.v24.i29.3281
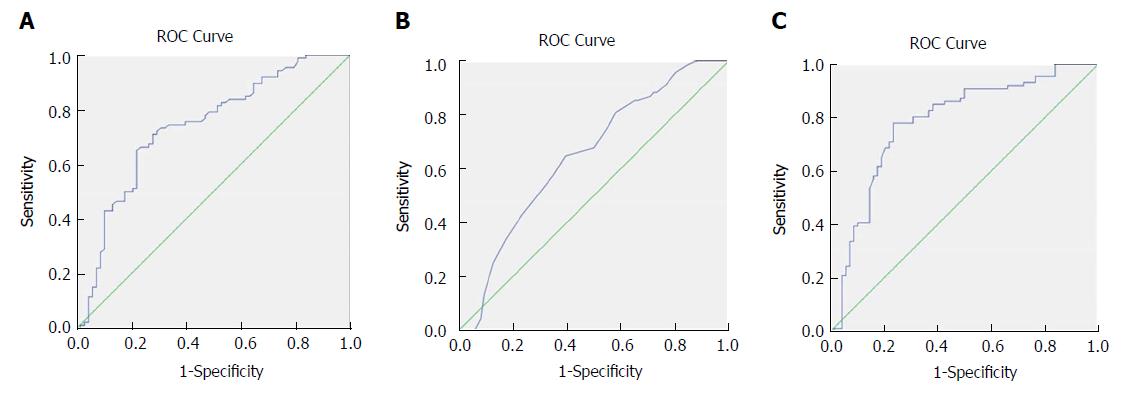
Figure 1 Receiver operating characteristics curve analysis based on fibrinogen (A), albumin (B), and fibrinogen to albumin ratio (C) for overall survival.
A: The area under the ROC curve (AUC) indicates the diagnostic power of preoperative plasma fibrinogen concentration. In this model, the optimum cut-off point for fibrinogen concentration was 3.47 g/L, AUC was 0.735 (95%CI: 0.654-0.816), with a sensitivity of 0.709 and a specificity of 0.721 by the Youden index; B: The AUC indicates the diagnostic power of preoperative plasma albumin level. In this model, the optimum cut-off point for albumin level was 40.5 g/L, AUC was 0.648 (95%CI: 0.562-0.735), with a sensitivity of 0.647 and a specificity of 0.605 by the Youden index; C: The AUC indicates the diagnostic power of preoperative FAR. In this model, the optimum cut-off point for FAR was 0.08, AUC was 0.783 (95%CI: 0.707-0.859), with a sensitivity of 0.779 and a specificity of 0.765 by the Youden index. ROC: Receiver operating characteristics curve.
- Citation: Xu WY, Zhang HH, Xiong JP, Yang XB, Bai Y, Lin JZ, Long JY, Zheng YC, Zhao HT, Sang XT. Prognostic significance of the fibrinogen-to-albumin ratio in gallbladder cancer patients. World J Gastroenterol 2018; 24(29): 3281-3292
- URL: https://www.wjgnet.com/1007-9327/full/v24/i29/3281.htm
- DOI: https://dx.doi.org/10.3748/wjg.v24.i29.3281


