Copyright
©The Author(s) 2018.
World J Gastroenterol. Aug 7, 2018; 24(29): 3260-3272
Published online Aug 7, 2018. doi: 10.3748/wjg.v24.i29.3260
Published online Aug 7, 2018. doi: 10.3748/wjg.v24.i29.3260
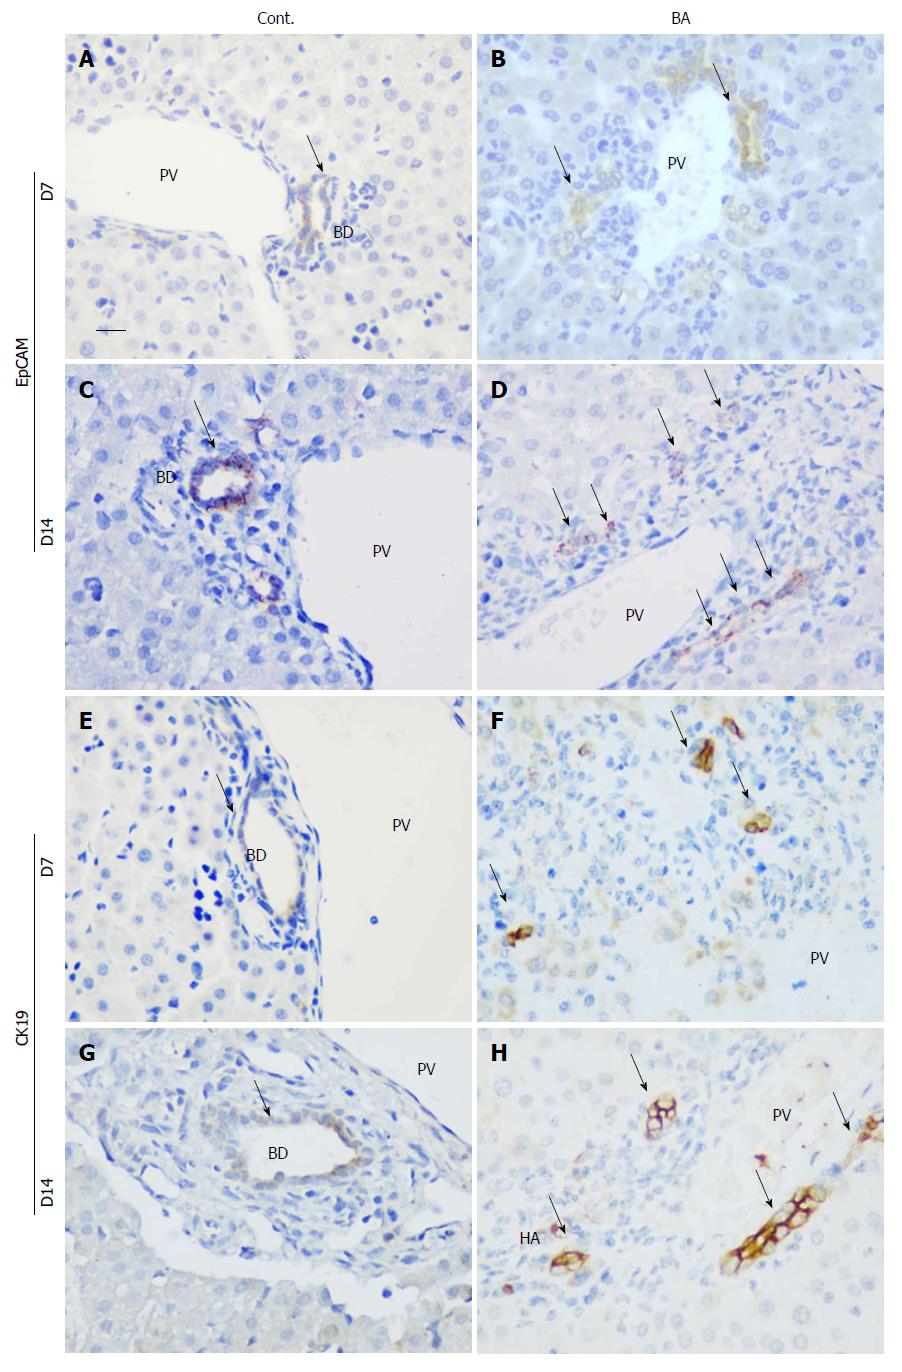
Figure 3 Expression levels of EpCAM and CK19 in the liver and ultrastructure of biliary epithelial cells.
The expression levels of EpCAM and CK19 were analyzed using immunohistochemical staining with antibodies. The tissue sections were collected at day 7 (A, B, E and F) and day 14 (C, D, G and H). After they were dewaxed, the sections were stained with EpCAM and CK19 antibodies, and a comparison of the mice in the control group (Cont.) and those in the rhesus rotavirus inoculation group was performed. The scale bar shown is 100 μm. The black arrow indicates the positive signal. BA: Biliary atresia; CD: Cystic duct; CBD: Common bile duct; PT: Portal triad; PV: Portal vein; HA: Hepatic artery; BD: Bile duct.
- Citation: Zhang RZ, Zeng XH, Lin ZF, Ming-Fu, Tong YL, Lui VC, Tam PK, Lamb JR, Xia HM, Chen Y. Downregulation of Hes1 expression in experimental biliary atresia and its effects on bile duct structure. World J Gastroenterol 2018; 24(29): 3260-3272
- URL: https://www.wjgnet.com/1007-9327/full/v24/i29/3260.htm
- DOI: https://dx.doi.org/10.3748/wjg.v24.i29.3260


