Copyright
©The Author(s) 2018.
World J Gastroenterol. Jul 28, 2018; 24(28): 3181-3191
Published online Jul 28, 2018. doi: 10.3748/wjg.v24.i28.3181
Published online Jul 28, 2018. doi: 10.3748/wjg.v24.i28.3181
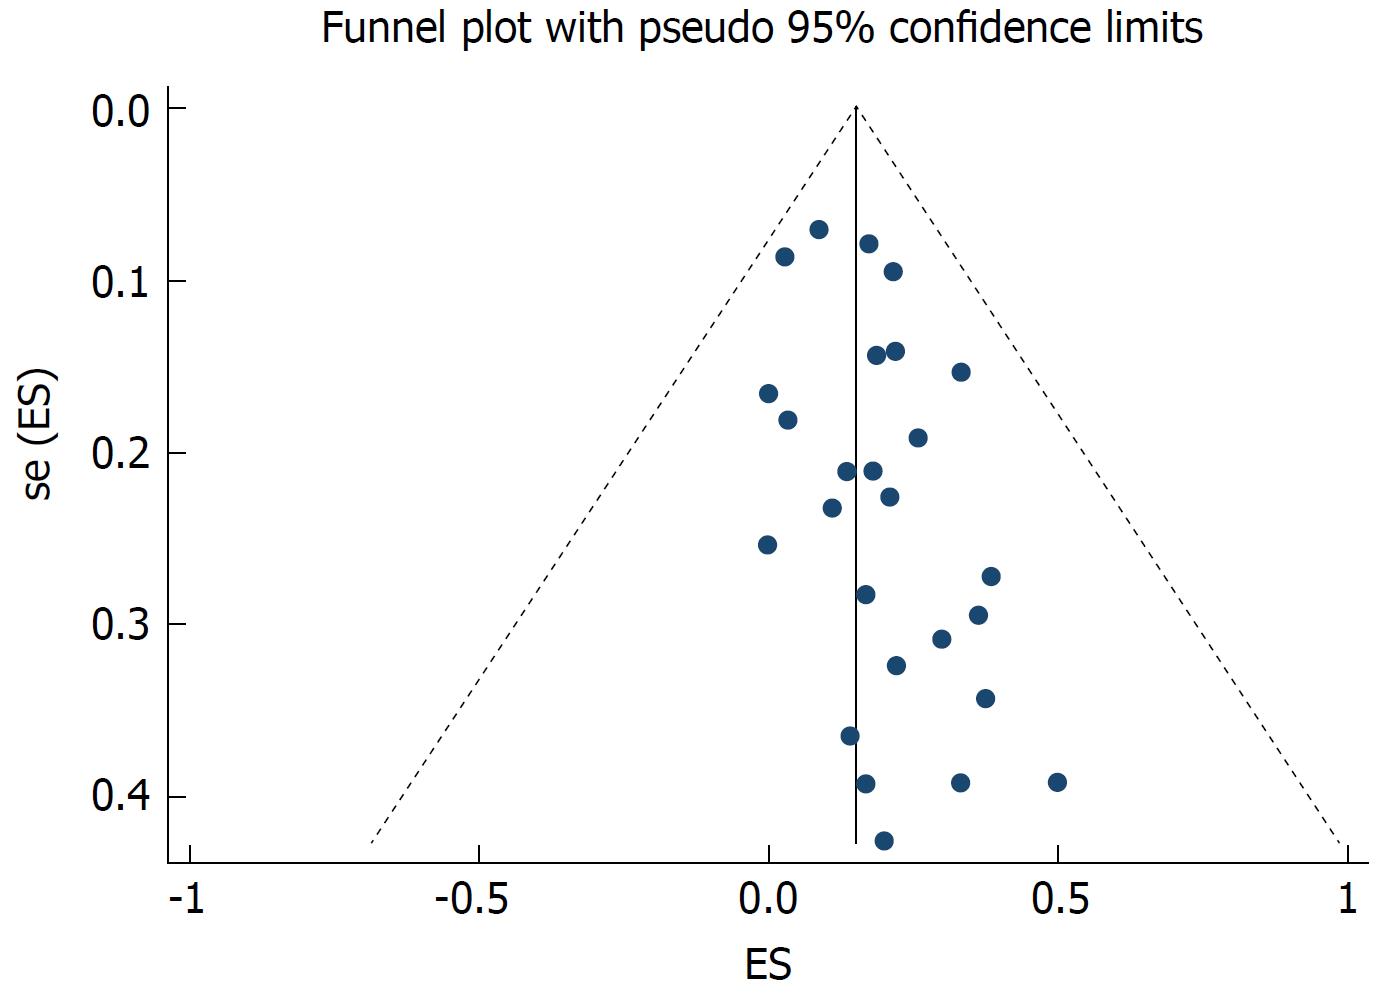
Figure 4 Funnel plot of 26 studies estimating the hepatitis B virus reactivation rates in hepatitis C virus patients with chronic hepatitis B virus infection.
The vertical line corresponds to the summary hepatitis B virus reactivation rates as estimated from the random effect model. The publication bias is presented; P = 0.03, as tested by Egger’s test.
- Citation: Jiang XW, Ye JZ, Li YT, Li LJ. Hepatitis B reactivation in patients receiving direct-acting antiviral therapy or interferon-based therapy for hepatitis C: A systematic review and meta-analysis. World J Gastroenterol 2018; 24(28): 3181-3191
- URL: https://www.wjgnet.com/1007-9327/full/v24/i28/3181.htm
- DOI: https://dx.doi.org/10.3748/wjg.v24.i28.3181


