Copyright
©The Author(s) 2018.
World J Gastroenterol. Jul 28, 2018; 24(28): 3120-3129
Published online Jul 28, 2018. doi: 10.3748/wjg.v24.i28.3120
Published online Jul 28, 2018. doi: 10.3748/wjg.v24.i28.3120
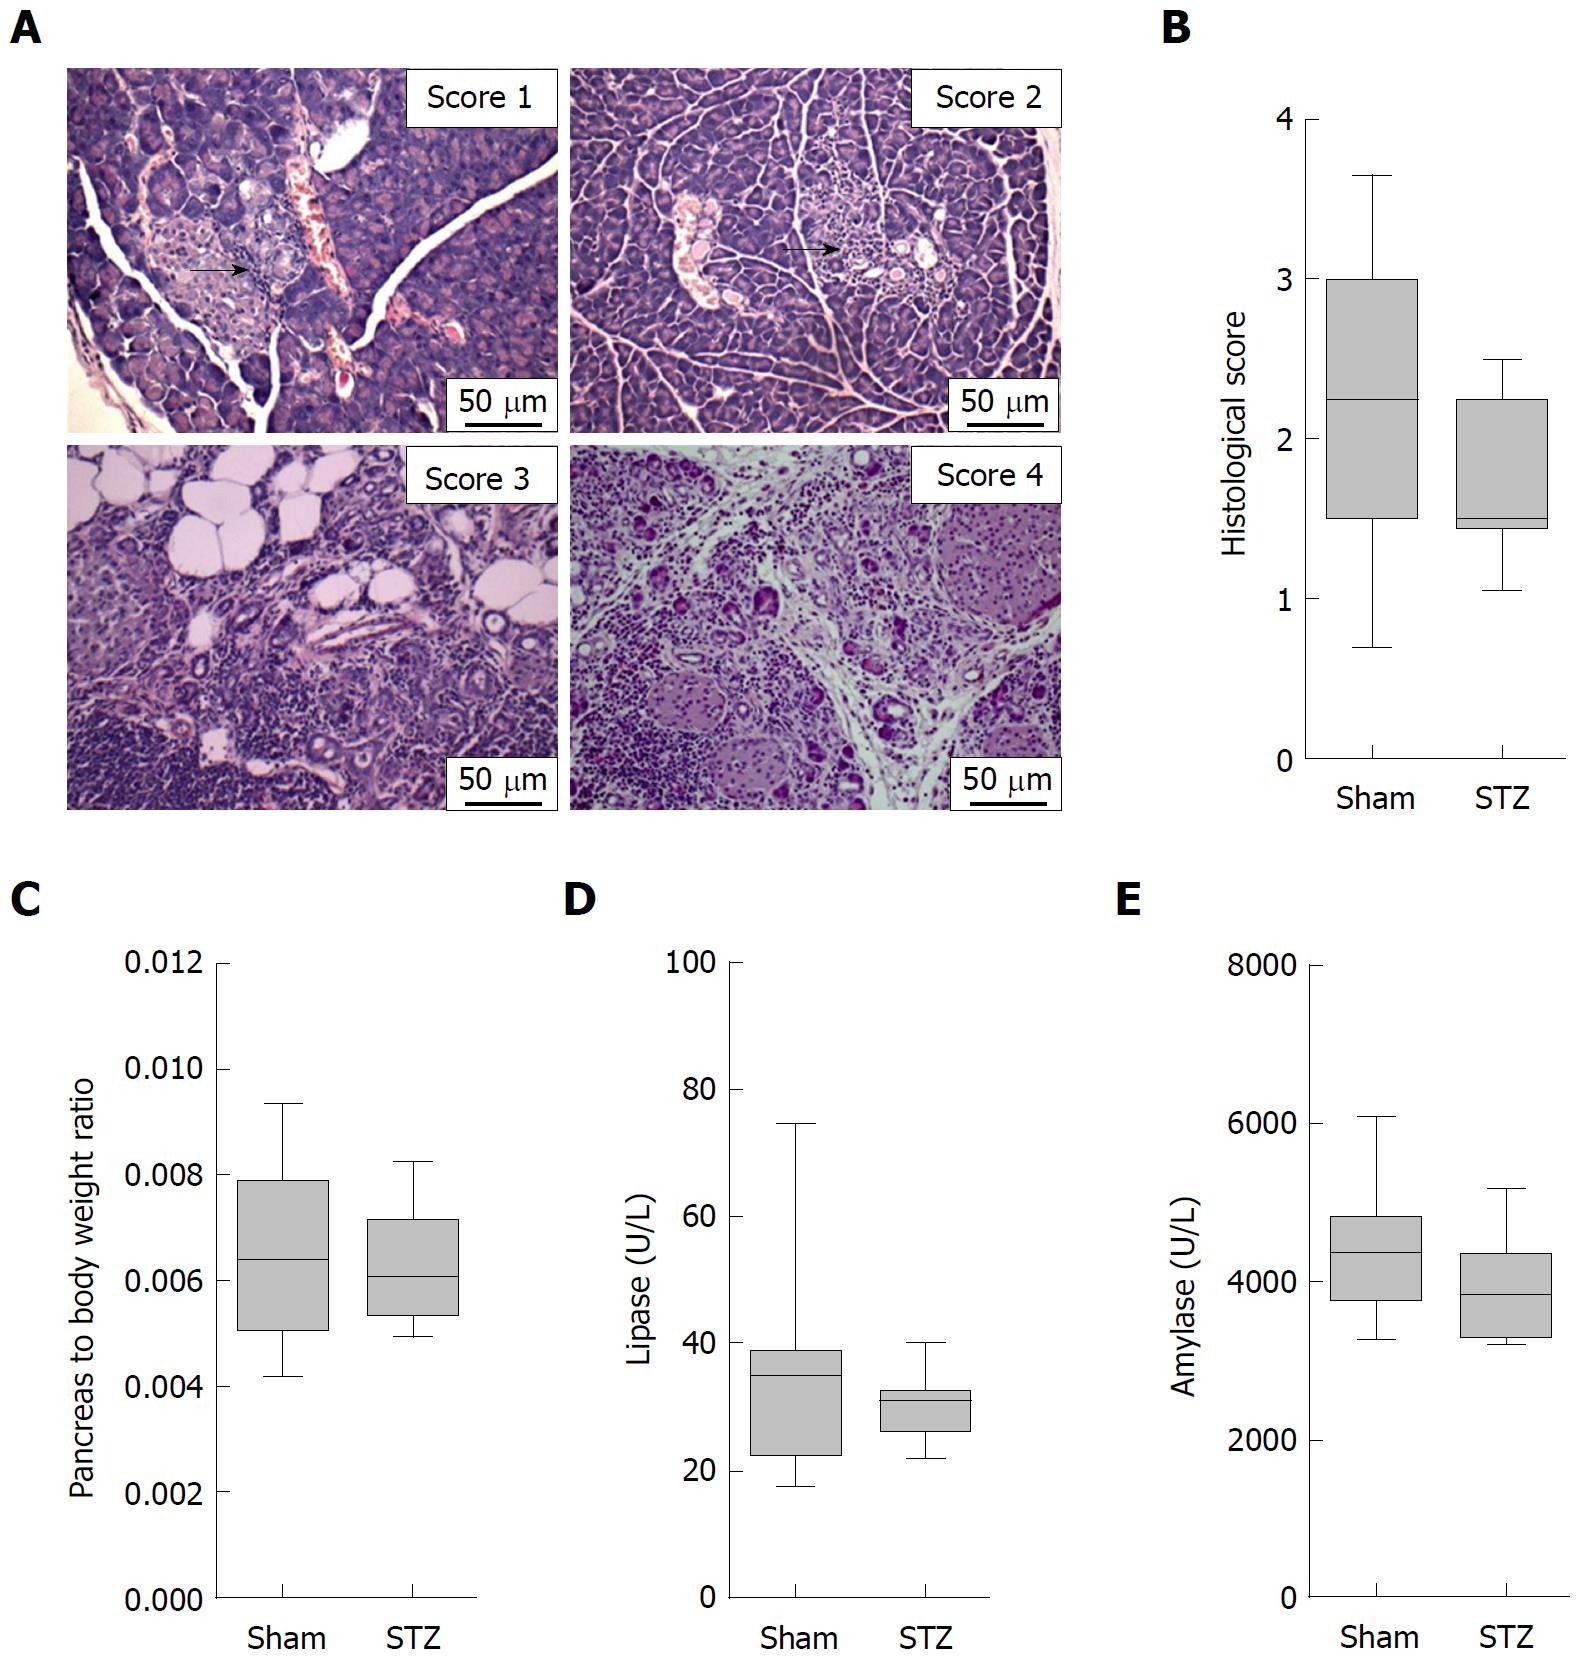
Figure 2 Evaluation of autoimmune pancreatitis.
A: Representative images of the histological scores of autoimmune pancreatitis. Arrows point at small inflammatory infiltrates embedded in healthy surrounding tissue; B: hyperglycemia (STZ) reduced the histological score slightly compared to normoglycemic controls (sham); little differences are observed in the pancreas to body weight ratio (C), lipase activity (D), and amylase activity (E). The number of animals evaluated was n = 19 (sham) and n = 17 (STZ) in Panel B and C and n = 19 (Sham) and n = 15 (STZ) in D and E. Scale bar = 50 μm. STZ: Streptozotocin-treated.
- Citation: Müller-Graff FT, Fitzner B, Jaster R, Vollmar B, Zechner D. Impact of hyperglycemia on autoimmune pancreatitis and regulatory T-cells. World J Gastroenterol 2018; 24(28): 3120-3129
- URL: https://www.wjgnet.com/1007-9327/full/v24/i28/3120.htm
- DOI: https://dx.doi.org/10.3748/wjg.v24.i28.3120


