Copyright
©The Author(s) 2018.
World J Gastroenterol. Jun 21, 2018; 24(23): 2491-2500
Published online Jun 21, 2018. doi: 10.3748/wjg.v24.i23.2491
Published online Jun 21, 2018. doi: 10.3748/wjg.v24.i23.2491
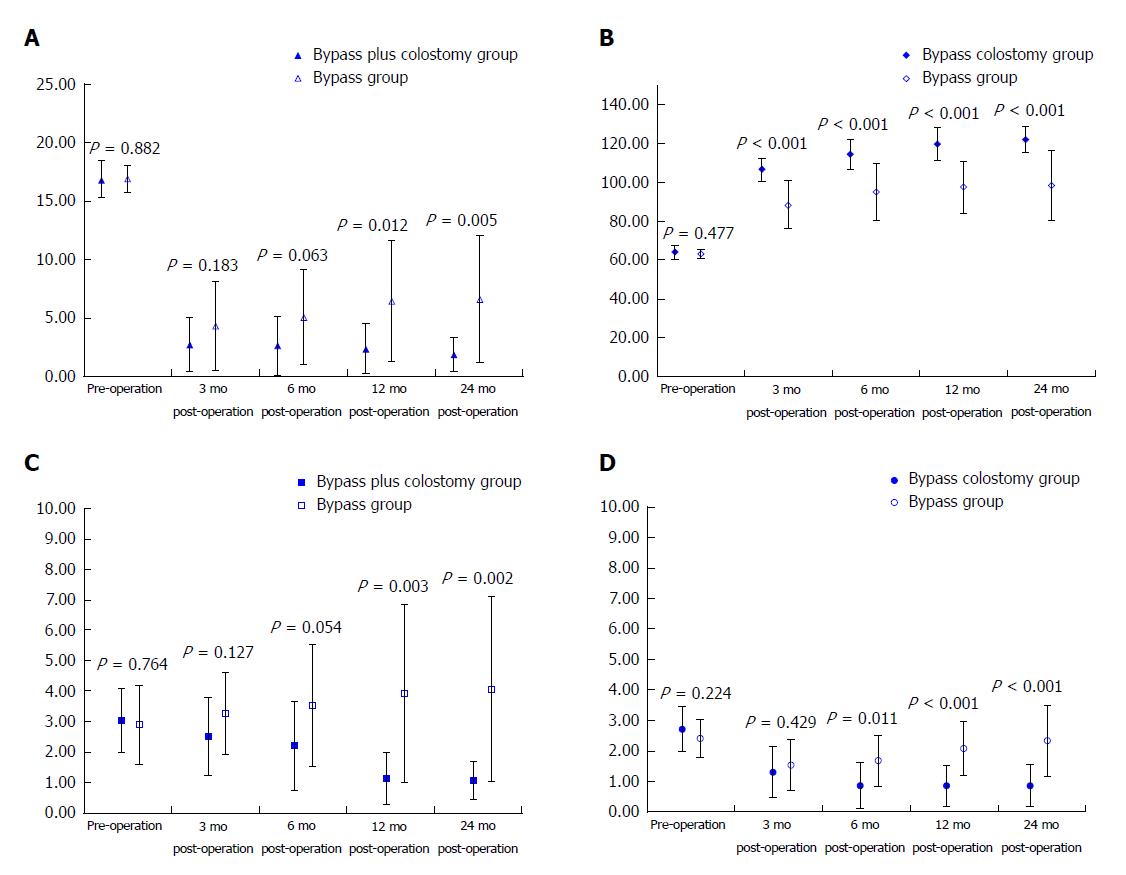
Figure 1 X-axis: Preoperative and postoperative time points.
A: Y-axis: WCS scores; ▲: Mean of WCS in the bypass plus colostomy group; △: Mean of WCS in the bypass group; │: 95% confidence interval of WCS. B: Y-axis: GIQLI scores; ◆: Mean of GIQLI in the bypass plus colostomy group; ◇: Mean of GIQLI in the bypass group; │: 95% confidence interval of GIQLI. C: Y-axis: NRS scores; ■: Mean of NRS in the bypass plus colostomy group; □: Mean of NRS in the bypass group; │: 95% confidence interval of NRS. D: Y-axis: ABS scores; ●: Mean of ABS in the bypass plus colostomy group; ○: Mean of ABS in the bypass group; │: 95% confidence interval of ABS. WCS: Wexner constipation scale; GIQLI: Gastrointestinal quality of life index; ABS: Abdominal bloating score; NRS: Numerical rating scale.
- Citation: Yang Y, Cao YL, Wang WH, Zhang YY, Zhao N, Wei D. Subtotal colonic bypass plus colostomy with antiperistaltic cecoproctostomy for the treatment of slow transit constipation in an aged population: A retrospective control study. World J Gastroenterol 2018; 24(23): 2491-2500
- URL: https://www.wjgnet.com/1007-9327/full/v24/i23/2491.htm
- DOI: https://dx.doi.org/10.3748/wjg.v24.i23.2491


