Copyright
©The Author(s) 2018.
World J Gastroenterol. Jun 21, 2018; 24(23): 2413-2426
Published online Jun 21, 2018. doi: 10.3748/wjg.v24.i23.2413
Published online Jun 21, 2018. doi: 10.3748/wjg.v24.i23.2413
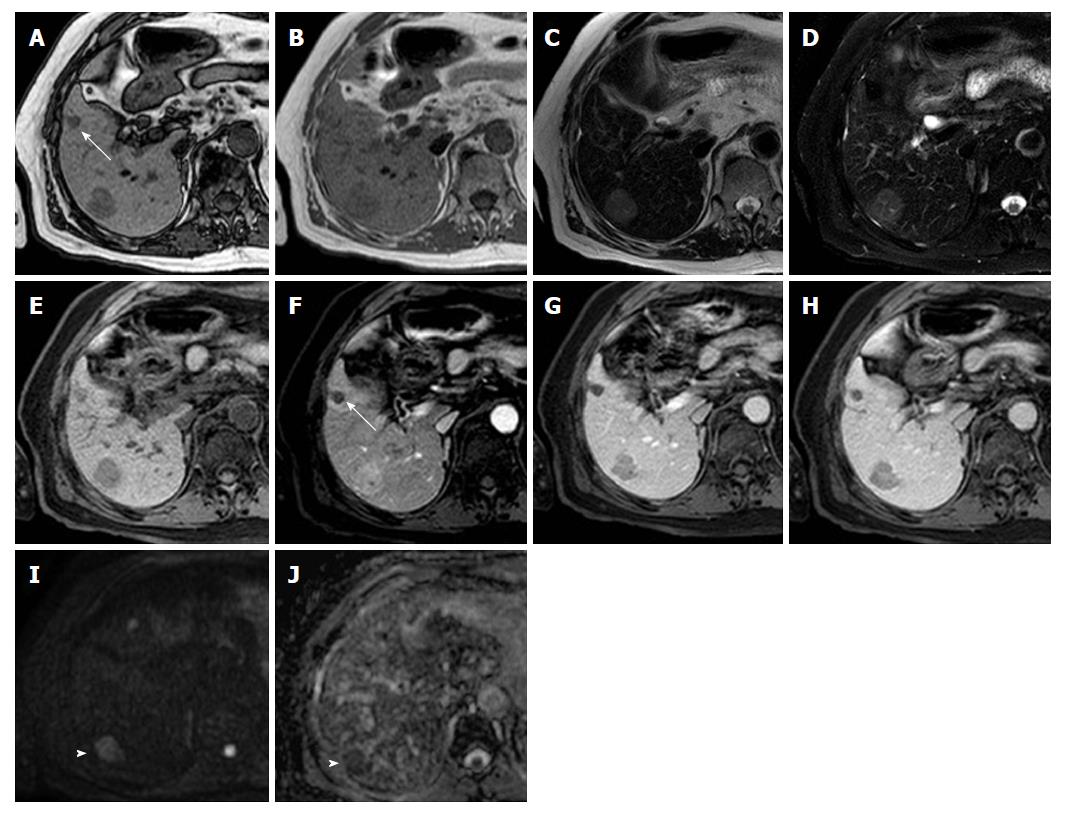
Figure 4 Gd-EOB-DTPA enhanced magnetic resonance images of a 61-year-old patient with hepatocellular carcinoma nodule in the VII segment of the liver.
Panels A-B: A single nodule slightly hypointense on the T1-weighted “in phase” sequence (A) with a signal drop in the “out of phase” sequence, as per fat deposition. Panels C-D: On T2-weighted image without and with fat saturation the nodule appears slightly hyperintense. Panels E-H: Dynamic contrast-enhanced images demonstrate the typical contrast behavior of hepatocellular carcinoma: Which appear hypervascular during the arterial phase (F) with wash-out in portal and delayed phase (G-H). Panel I-J: Diffusion weighted image (DWI) shows the hyperintense pattern of the lesion which appear hypointense on the relative apparent diffusion coefficient map (arrowhead). Previously treated lesion with transarterial chemoembolization is recognizable, in panel A-E-F-G-H, at V segment of the liver (arrow). No any restriction of signal intensity is evident on DWI (panel I-J).
- Citation: Ippolito D, Inchingolo R, Grazioli L, Drago SG, Nardella M, Gatti M, Faletti R. Recent advances in non-invasive magnetic resonance imaging assessment of hepatocellular carcinoma. World J Gastroenterol 2018; 24(23): 2413-2426
- URL: https://www.wjgnet.com/1007-9327/full/v24/i23/2413.htm
- DOI: https://dx.doi.org/10.3748/wjg.v24.i23.2413


