Copyright
©The Author(s) 2018.
World J Gastroenterol. Jan 14, 2018; 24(2): 303-309
Published online Jan 14, 2018. doi: 10.3748/wjg.v24.i2.303
Published online Jan 14, 2018. doi: 10.3748/wjg.v24.i2.303
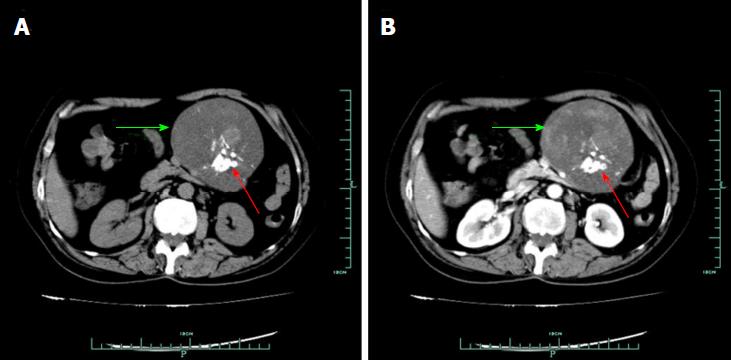
Figure 1 Computed tomography findings.
A: In a native CT scan, the mass in the upper left abdomen appeared well defined (green arrow), while regions of high density were visible (red arrow); B: On the contrast-enhanced CT, the mass was inhomogeneous and slightly enhanced, and regions of high density were also visible (green arrow). CT: Computed tomography.
- Citation: Wu YS, Xu SY, Jin J, Sun K, Hu ZH, Wang WL. Successful treatment of a giant ossified benign mesenteric schwannoma. World J Gastroenterol 2018; 24(2): 303-309
- URL: https://www.wjgnet.com/1007-9327/full/v24/i2/303.htm
- DOI: https://dx.doi.org/10.3748/wjg.v24.i2.303


