Copyright
©The Author(s) 2018.
World J Gastroenterol. May 21, 2018; 24(19): 2095-2107
Published online May 21, 2018. doi: 10.3748/wjg.v24.i19.2095
Published online May 21, 2018. doi: 10.3748/wjg.v24.i19.2095
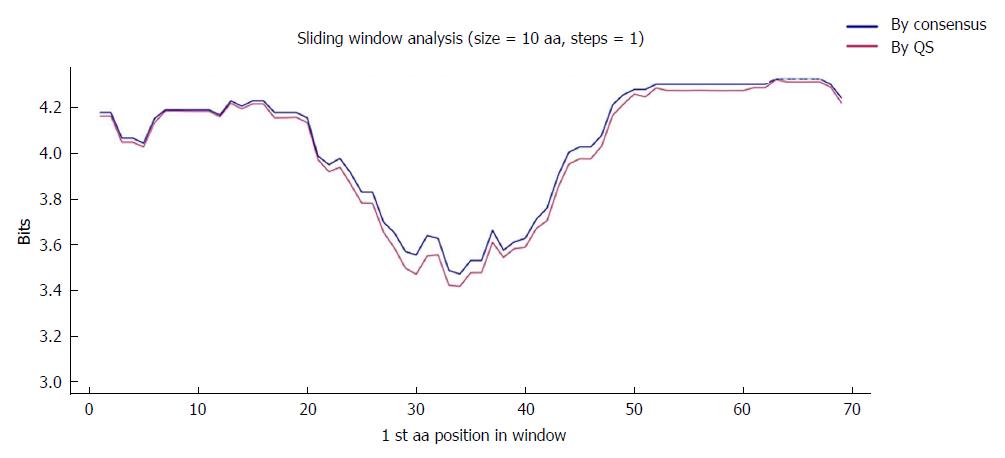
Figure 4 Sliding window of the coded the core and X protein amino acid sequence (aa 1-79).
Each point on the graph is the result of the mean information content (IC, bits) between windows of 10-aa size with displacement between them in 1-aa steps. The purple line represents the mean IC from the multiple alignments of all haplotypes (in abundance > 0.25%) in the quasispecies (QS) of all patients (n = 330), whereas the blue line shows the mean IC obtained from the multiple alignments of the consensus obtained for each patient (n = 27).
- Citation: González C, Tabernero D, Cortese MF, Gregori J, Casillas R, Riveiro-Barciela M, Godoy C, Sopena S, Rando A, Yll M, Lopez-Martinez R, Quer J, Esteban R, Buti M, Rodríguez-Frías F. Detection of hyper-conserved regions in hepatitis B virus X gene potentially useful for gene therapy. World J Gastroenterol 2018; 24(19): 2095-2107
- URL: https://www.wjgnet.com/1007-9327/full/v24/i19/2095.htm
- DOI: https://dx.doi.org/10.3748/wjg.v24.i19.2095


