Copyright
©The Author(s) 2018.
World J Gastroenterol. Apr 28, 2018; 24(16): 1748-1765
Published online Apr 28, 2018. doi: 10.3748/wjg.v24.i16.1748
Published online Apr 28, 2018. doi: 10.3748/wjg.v24.i16.1748
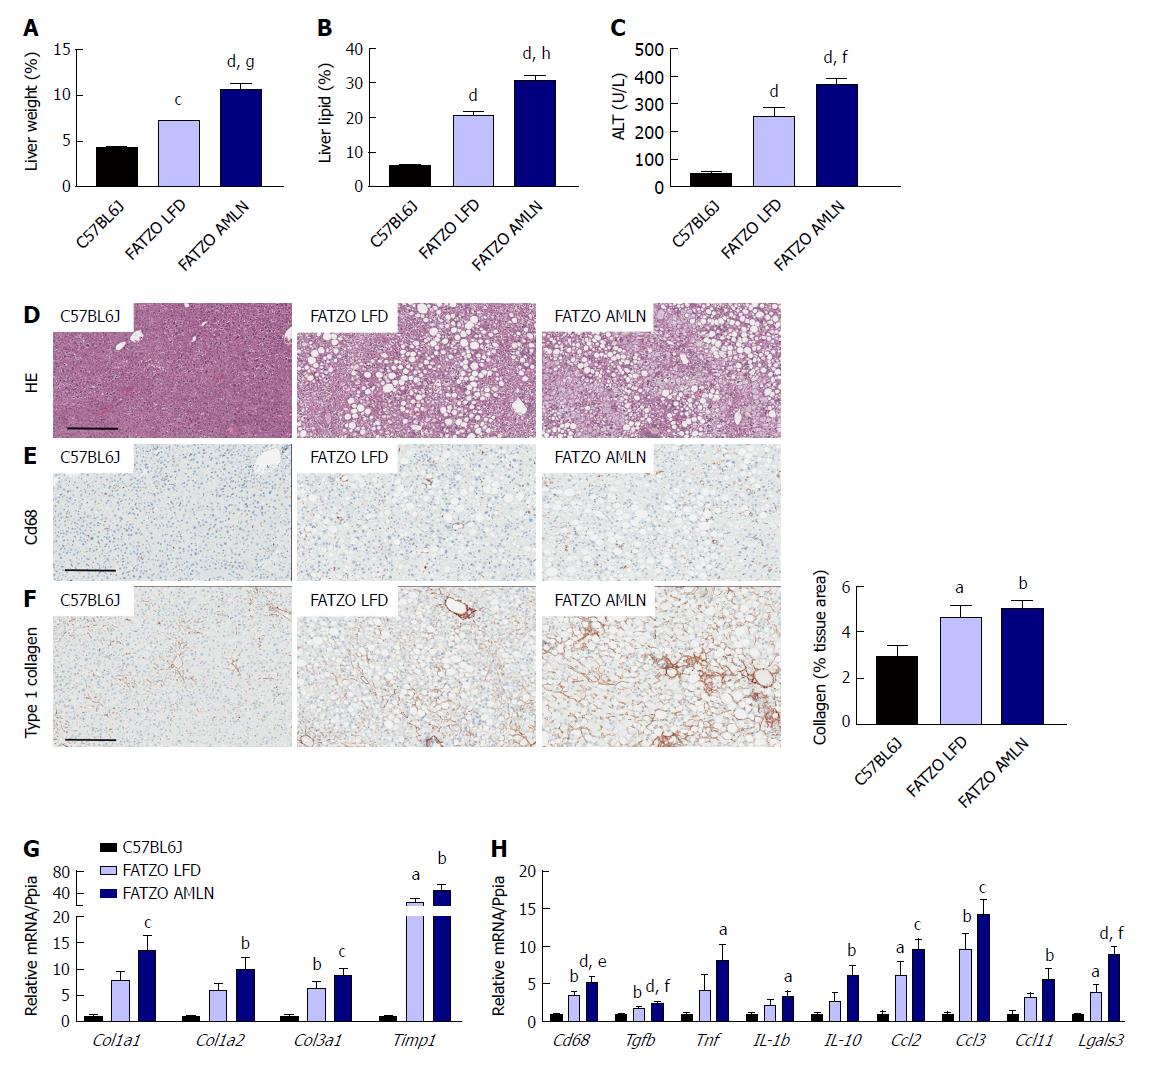
Figure 7 Comparison of metabolic and hepatic abnormalities associated with diet-induced nonalcoholic fatty liver disease/nonalcoholic steatohepatitis in FATZO mice.
Liver weight (A), liver lipid (B), and plasma alanine aminotransferase (ALT) levels (C) of lean (C57BL6J) and FATZO mice maintained on control LFD (FATZO LFD) or AMLN diet (FATZO AMLN) for 12 wk; (D): Representative hematoxylin and eosin stained liver sections and quantification of percentage of liver area containing macrosteatosis; (E): Representative CD68-stained liver sections; (F): Representative collagen type 1 alpha 1 stained liver sections and quantification of collagen area; (G, H): Hepatic expression of genes associated with fibrosis and inflammation. aP ≤ 0.05, bP ≤ 0.01, cP ≤ 0.001, dP ≤ 0.0001 vs C57BL6J; eP ≤ 0.05, fP ≤ 0.01, gP ≤ 0.001, hP ≤ 0.0001 vs LFD. LFD: Low-fat diet.
- Citation: Boland ML, Oldham S, Boland BB, Will S, Lapointe JM, Guionaud S, Rhodes CJ, Trevaskis JL. Nonalcoholic steatohepatitis severity is defined by a failure in compensatory antioxidant capacity in the setting of mitochondrial dysfunction. World J Gastroenterol 2018; 24(16): 1748-1765
- URL: https://www.wjgnet.com/1007-9327/full/v24/i16/1748.htm
- DOI: https://dx.doi.org/10.3748/wjg.v24.i16.1748


