Copyright
©The Author(s) 2018.
World J Gastroenterol. Apr 28, 2018; 24(16): 1748-1765
Published online Apr 28, 2018. doi: 10.3748/wjg.v24.i16.1748
Published online Apr 28, 2018. doi: 10.3748/wjg.v24.i16.1748
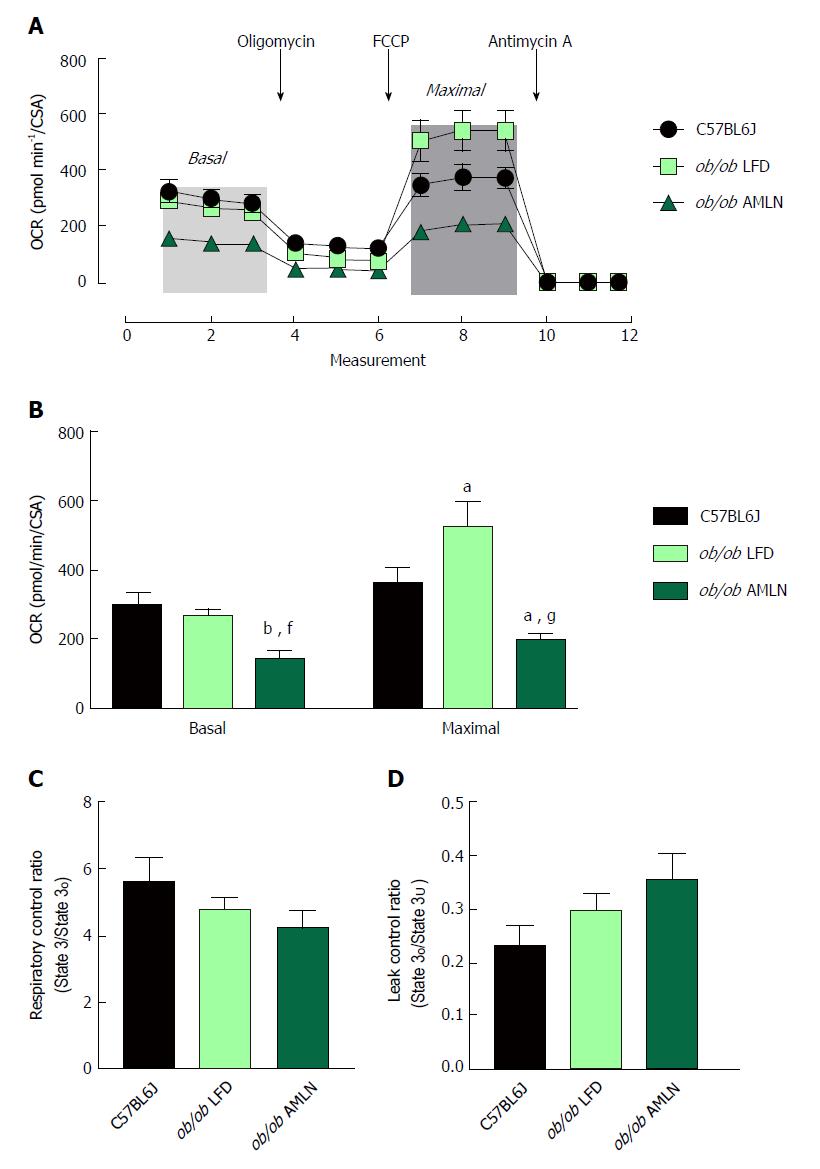
Figure 5 Mitochondria from ob/ob AMLN livers display reduced respiratory capacity and increased proton leak.
(A): Oxygen consumption of primary hepatocytes isolated from C57BL6J, ob/ob LFD and ob/ob AMLN livers normalized to mitochondrial content (citrate synthase activity, CSA). Changes in mitochondrial respiration in response to oligomycin, FCCP and antimycin A are shown. Light grey box = basal respiration, dark grey box = maximal uncoupled respiration; (B): Quantification of baseline oxygen consumption (basal respiration) and FCCP-stimulated oxygen consumption (maximal respiration) normalized to CSA; (C): Mitochondrial respiratory control ratio, a measure of mitochondrial coupling, defined as state 3/ state o respiration of mitochondria isolated from the livers of C57BL6J, ob/ob LFD and ob/ob AMLN mice; (D): Mitochondrial leaking control ratio, a measure of proton leak, defined as state o/ state 3U respiration. aP ≤ 0.05, bP ≤ 0.01, vs C57BL6J; fP ≤ 0.01, gP ≤ 0.001, vs LFD. LFD: Low-fat diet.
- Citation: Boland ML, Oldham S, Boland BB, Will S, Lapointe JM, Guionaud S, Rhodes CJ, Trevaskis JL. Nonalcoholic steatohepatitis severity is defined by a failure in compensatory antioxidant capacity in the setting of mitochondrial dysfunction. World J Gastroenterol 2018; 24(16): 1748-1765
- URL: https://www.wjgnet.com/1007-9327/full/v24/i16/1748.htm
- DOI: https://dx.doi.org/10.3748/wjg.v24.i16.1748


