Copyright
©The Author(s) 2018.
World J Gastroenterol. Apr 28, 2018; 24(16): 1748-1765
Published online Apr 28, 2018. doi: 10.3748/wjg.v24.i16.1748
Published online Apr 28, 2018. doi: 10.3748/wjg.v24.i16.1748
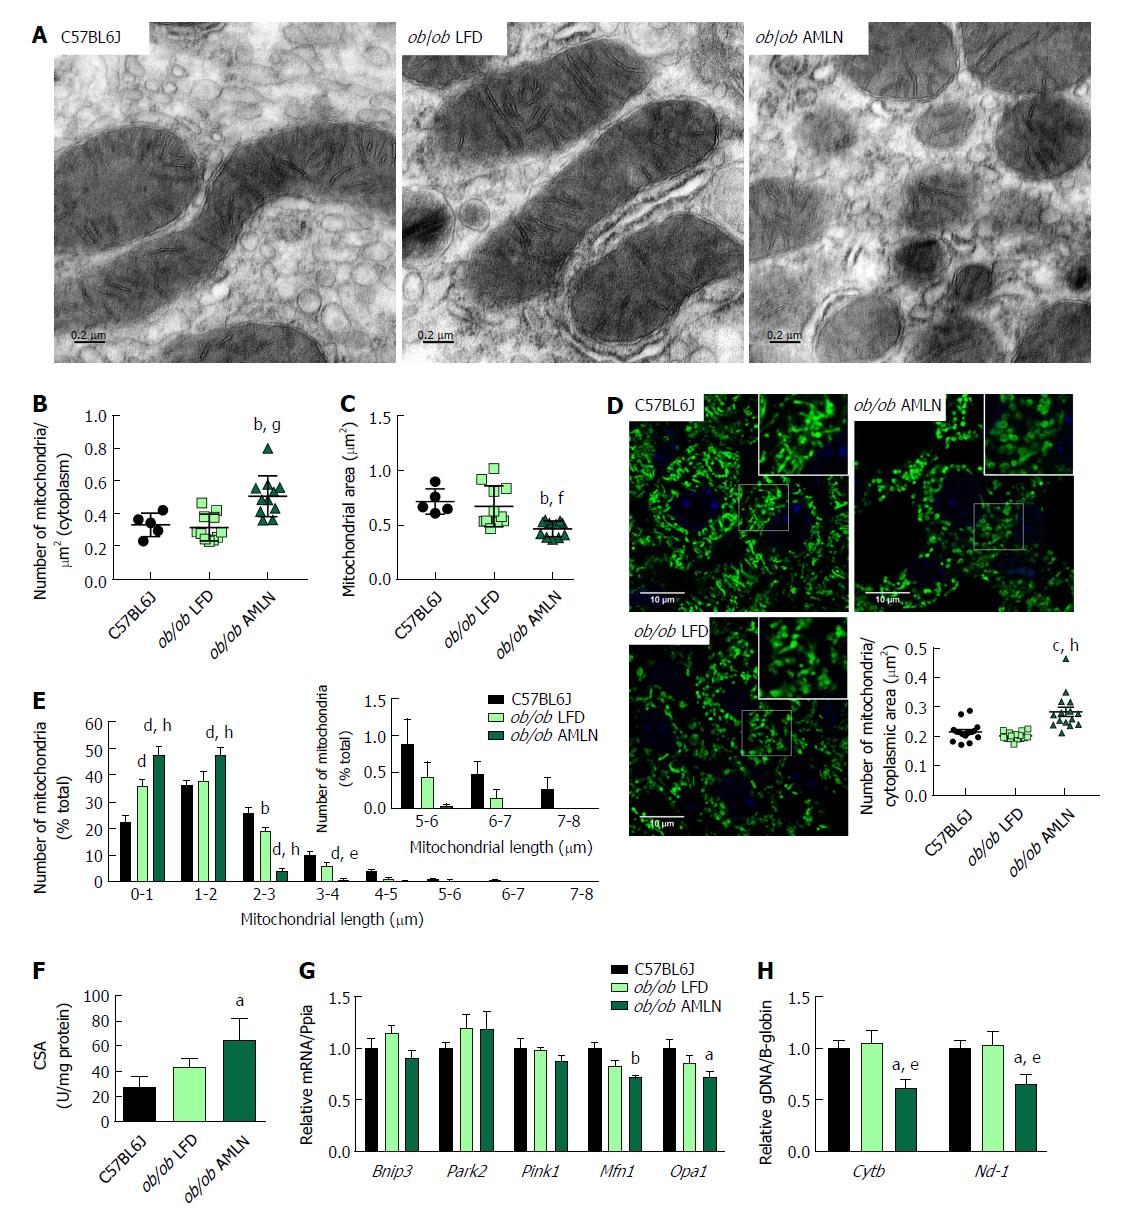
Figure 4 ob/ob AMLN hepatocytes display increased numbers of fragmented mitochondria.
(A) Transmission electron micrographs (TEM) showing mitochondrial morphology and ultrastructure in the liver. Scale bar = 0.2 μm. Quantification of the number of mitochondria (B) and mitochondrial area (C) from TEM images; (D): Confocal images of HSP60 stained liver sections and quantification of mitochondrial number per cytoplasmic area. Scale bar = 10 μm; (E): Histogram depicting the number of mitochondria per binned mitochondrial length as a percentage of total mitochondria per cell; (F): Mitochondrial content measured by citrate synthase activity in isolated primary hepatocytes; (G): Relative hepatic expression of genes associated with mitophagy; (H): Quantification of mitochondrial genome-encoded CytB or Nd1 relative to nuclear-encoded β-globin from total genomic DNA extracted from the liver. aP ≤ 0.05, bP ≤ 0.01, vs C57BL6J; eP ≤ 0.05, fP ≤ 0.01, gP ≤ 0.001, hP ≤ 0.0001 vs LFD. LFD: Low-fat diet.
- Citation: Boland ML, Oldham S, Boland BB, Will S, Lapointe JM, Guionaud S, Rhodes CJ, Trevaskis JL. Nonalcoholic steatohepatitis severity is defined by a failure in compensatory antioxidant capacity in the setting of mitochondrial dysfunction. World J Gastroenterol 2018; 24(16): 1748-1765
- URL: https://www.wjgnet.com/1007-9327/full/v24/i16/1748.htm
- DOI: https://dx.doi.org/10.3748/wjg.v24.i16.1748


