Copyright
©The Author(s) 2018.
World J Gastroenterol. Apr 28, 2018; 24(16): 1748-1765
Published online Apr 28, 2018. doi: 10.3748/wjg.v24.i16.1748
Published online Apr 28, 2018. doi: 10.3748/wjg.v24.i16.1748
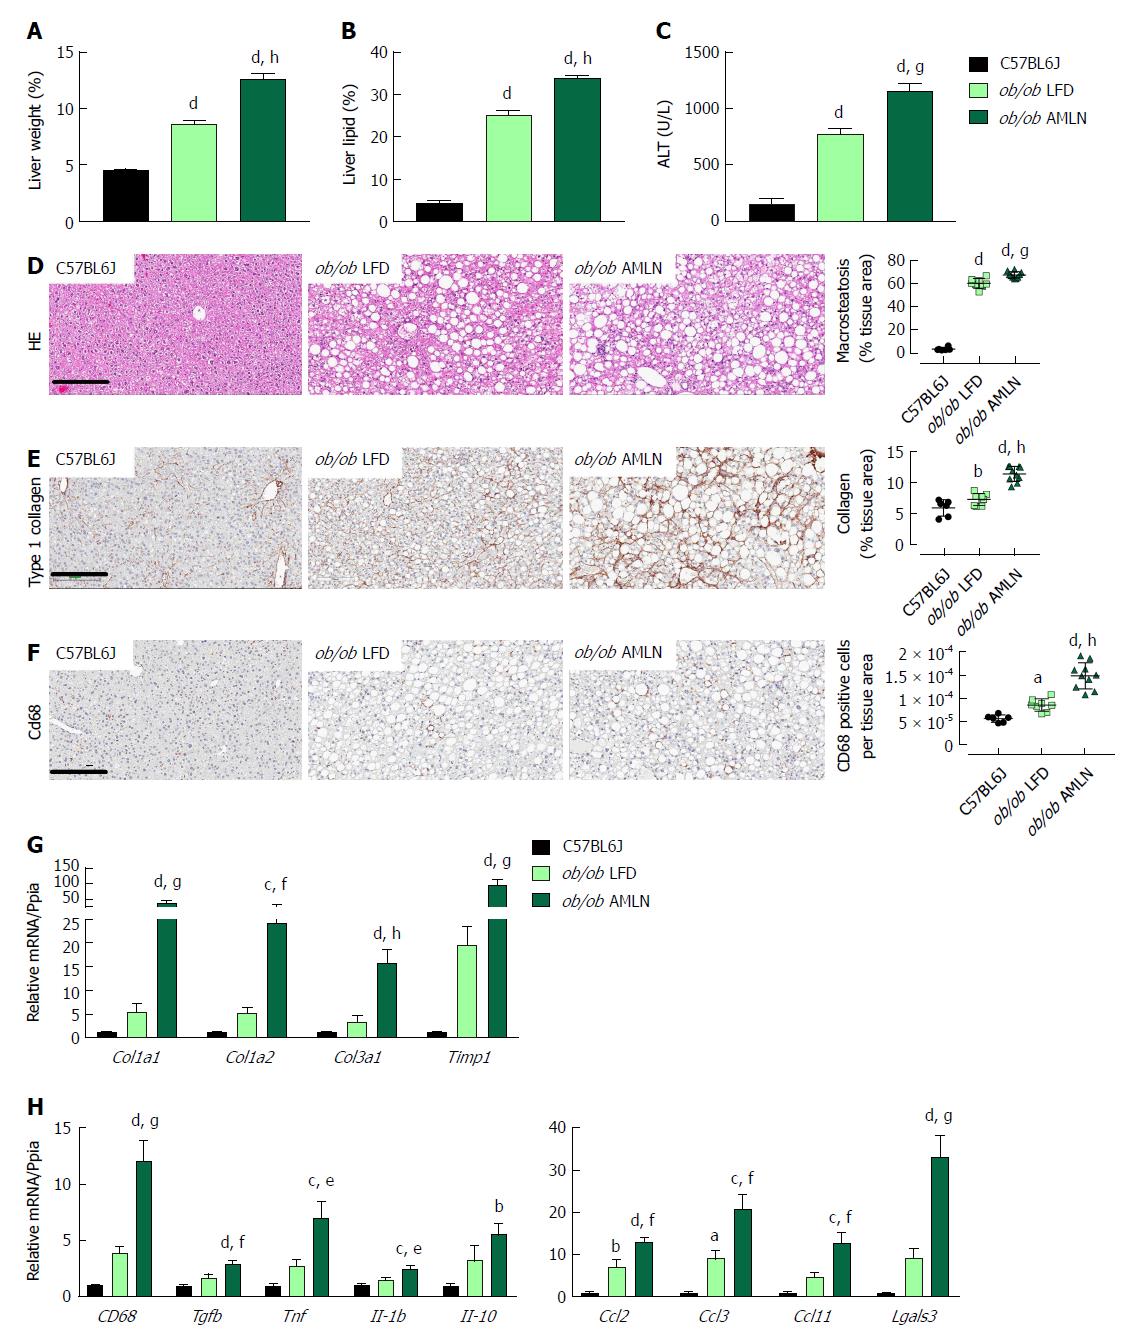
Figure 2 Comparison of metabolic and hepatic abnormalities associated with diet-induced nonalcoholic fatty liver disease/nonalcoholic steatohepatitis in ob/ob mice.
Liver weight (A), liver lipid (B), and plasma alanine aminotransferase (ALT) levels (C) of lean (C57BL6J) and ob/ob mice maintained on control low-fat diet (ob/ob LFD) or AMLN diet (ob/ob AMLN) for 12 wk; (D): Representative hematoxylin and eosin stained liver sections and quantification of percentage of liver area containing macrosteatosis; (E): Representative collagen type 1 alpha 1 stained liver sections and quantification of collagen area. Scale bar = 200 μm; (F): Representative CD68-stained liver sections and quantification of CD68-positive cells; G, H: Relative expression of genes associated with fibrosis and inflammation. aP ≤ 0.05, bP ≤ 0.01, cP ≤ 0.001, dP ≤ 0.0001 vs C57BL6J; eP ≤ 0.05, fP ≤ 0.01, gP ≤ 0.001, hP ≤ 0.0001 vs LFD. LFD: Low-fat diet.
- Citation: Boland ML, Oldham S, Boland BB, Will S, Lapointe JM, Guionaud S, Rhodes CJ, Trevaskis JL. Nonalcoholic steatohepatitis severity is defined by a failure in compensatory antioxidant capacity in the setting of mitochondrial dysfunction. World J Gastroenterol 2018; 24(16): 1748-1765
- URL: https://www.wjgnet.com/1007-9327/full/v24/i16/1748.htm
- DOI: https://dx.doi.org/10.3748/wjg.v24.i16.1748


