Copyright
©The Author(s) 2018.
World J Gastroenterol. Apr 21, 2018; 24(15): 1622-1631
Published online Apr 21, 2018. doi: 10.3748/wjg.v24.i15.1622
Published online Apr 21, 2018. doi: 10.3748/wjg.v24.i15.1622
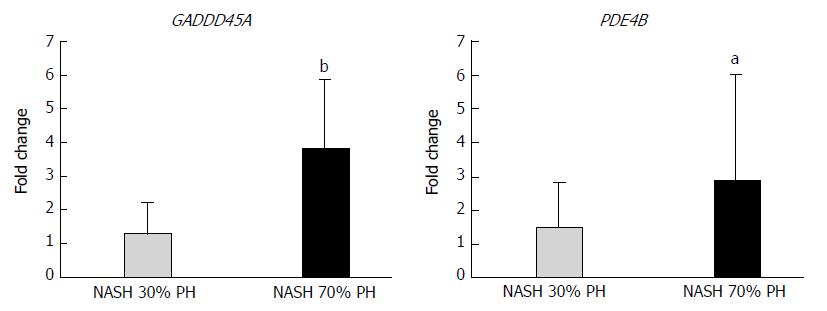
Figure 5 Gene expression of microarray.
GADD45A and PDE4B expression correlated with the cell cycle. RT-PCR demonstrated a significant difference between the groups. Data are expressed as the mean ± SD. n = 5-7 per groups. aP < 0.05; bP < 0.01. PH: partial hepatectomy; NASH: nonalcoholic steatohepatitis.
- Citation: Ozawa Y, Tamura T, Owada Y, Shimizu Y, Kemmochi A, Hisakura K, Matsuzaka T, Shimano H, Isoda H, Ohkohchi N. Evaluation of safety for hepatectomy in a novel mouse model with nonalcoholic-steatohepatitis. World J Gastroenterol 2018; 24(15): 1622-1631
- URL: https://www.wjgnet.com/1007-9327/full/v24/i15/1622.htm
- DOI: https://dx.doi.org/10.3748/wjg.v24.i15.1622


