Copyright
©The Author(s) 2018.
World J Gastroenterol. Apr 7, 2018; 24(13): 1451-1463
Published online Apr 7, 2018. doi: 10.3748/wjg.v24.i13.1451
Published online Apr 7, 2018. doi: 10.3748/wjg.v24.i13.1451
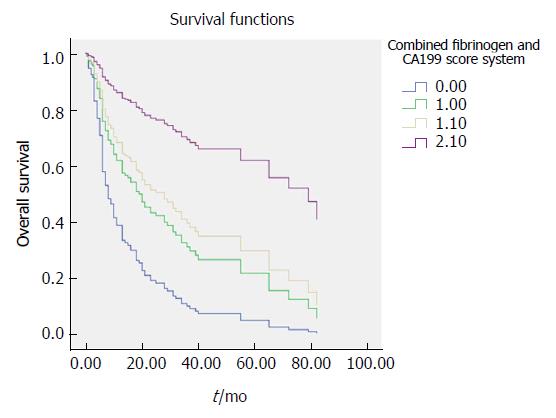
Figure 3 Survival curve according to the combined fibrinogen and CA199 scoring system.
Data compares the fibrinogen concentration > 3.47 g/L with CA199 level > 25.45 U/mA group, fibrinogen concentration > 3.47 g/L with CA199 level ≤ 25.45 U/mL group, fibrinogen concentration ≤ 3.47 g/L with CA199 level > 25.45 U/mL group and fibrinogen concentration ≤ 3.47 g/L with CA199 level ≤ 25.45 U/mL group. The number 0 for fibrinogen concentration > 3.47 g/L with CA199 level > 25.45 U/mL group, number 1 for fibrinogen concentration > 3.47g/L with CA199 level ≤ 25.45 U/mL group, number 1.1 for fibrinogen concentration ≤ 3.47 g/L with CA199 level > 25.45 U/mL group, number 2.1 for fibrinogen concentration ≤ 3.47 g/L with CA199 level ≤ 25.45 U/mL group.
- Citation: Xu WY, Zhang HH, Yang XB, Bai Y, Lin JZ, Long JY, Xiong JP, Zhang JW, Sang XT, Zhao HT. Prognostic significance of combined preoperative fibrinogen and CA199 in gallbladder cancer patients. World J Gastroenterol 2018; 24(13): 1451-1463
- URL: https://www.wjgnet.com/1007-9327/full/v24/i13/1451.htm
- DOI: https://dx.doi.org/10.3748/wjg.v24.i13.1451


