Copyright
©The Author(s) 2018.
World J Gastroenterol. Mar 14, 2018; 24(10): 1152-1166
Published online Mar 14, 2018. doi: 10.3748/wjg.v24.i10.1152
Published online Mar 14, 2018. doi: 10.3748/wjg.v24.i10.1152
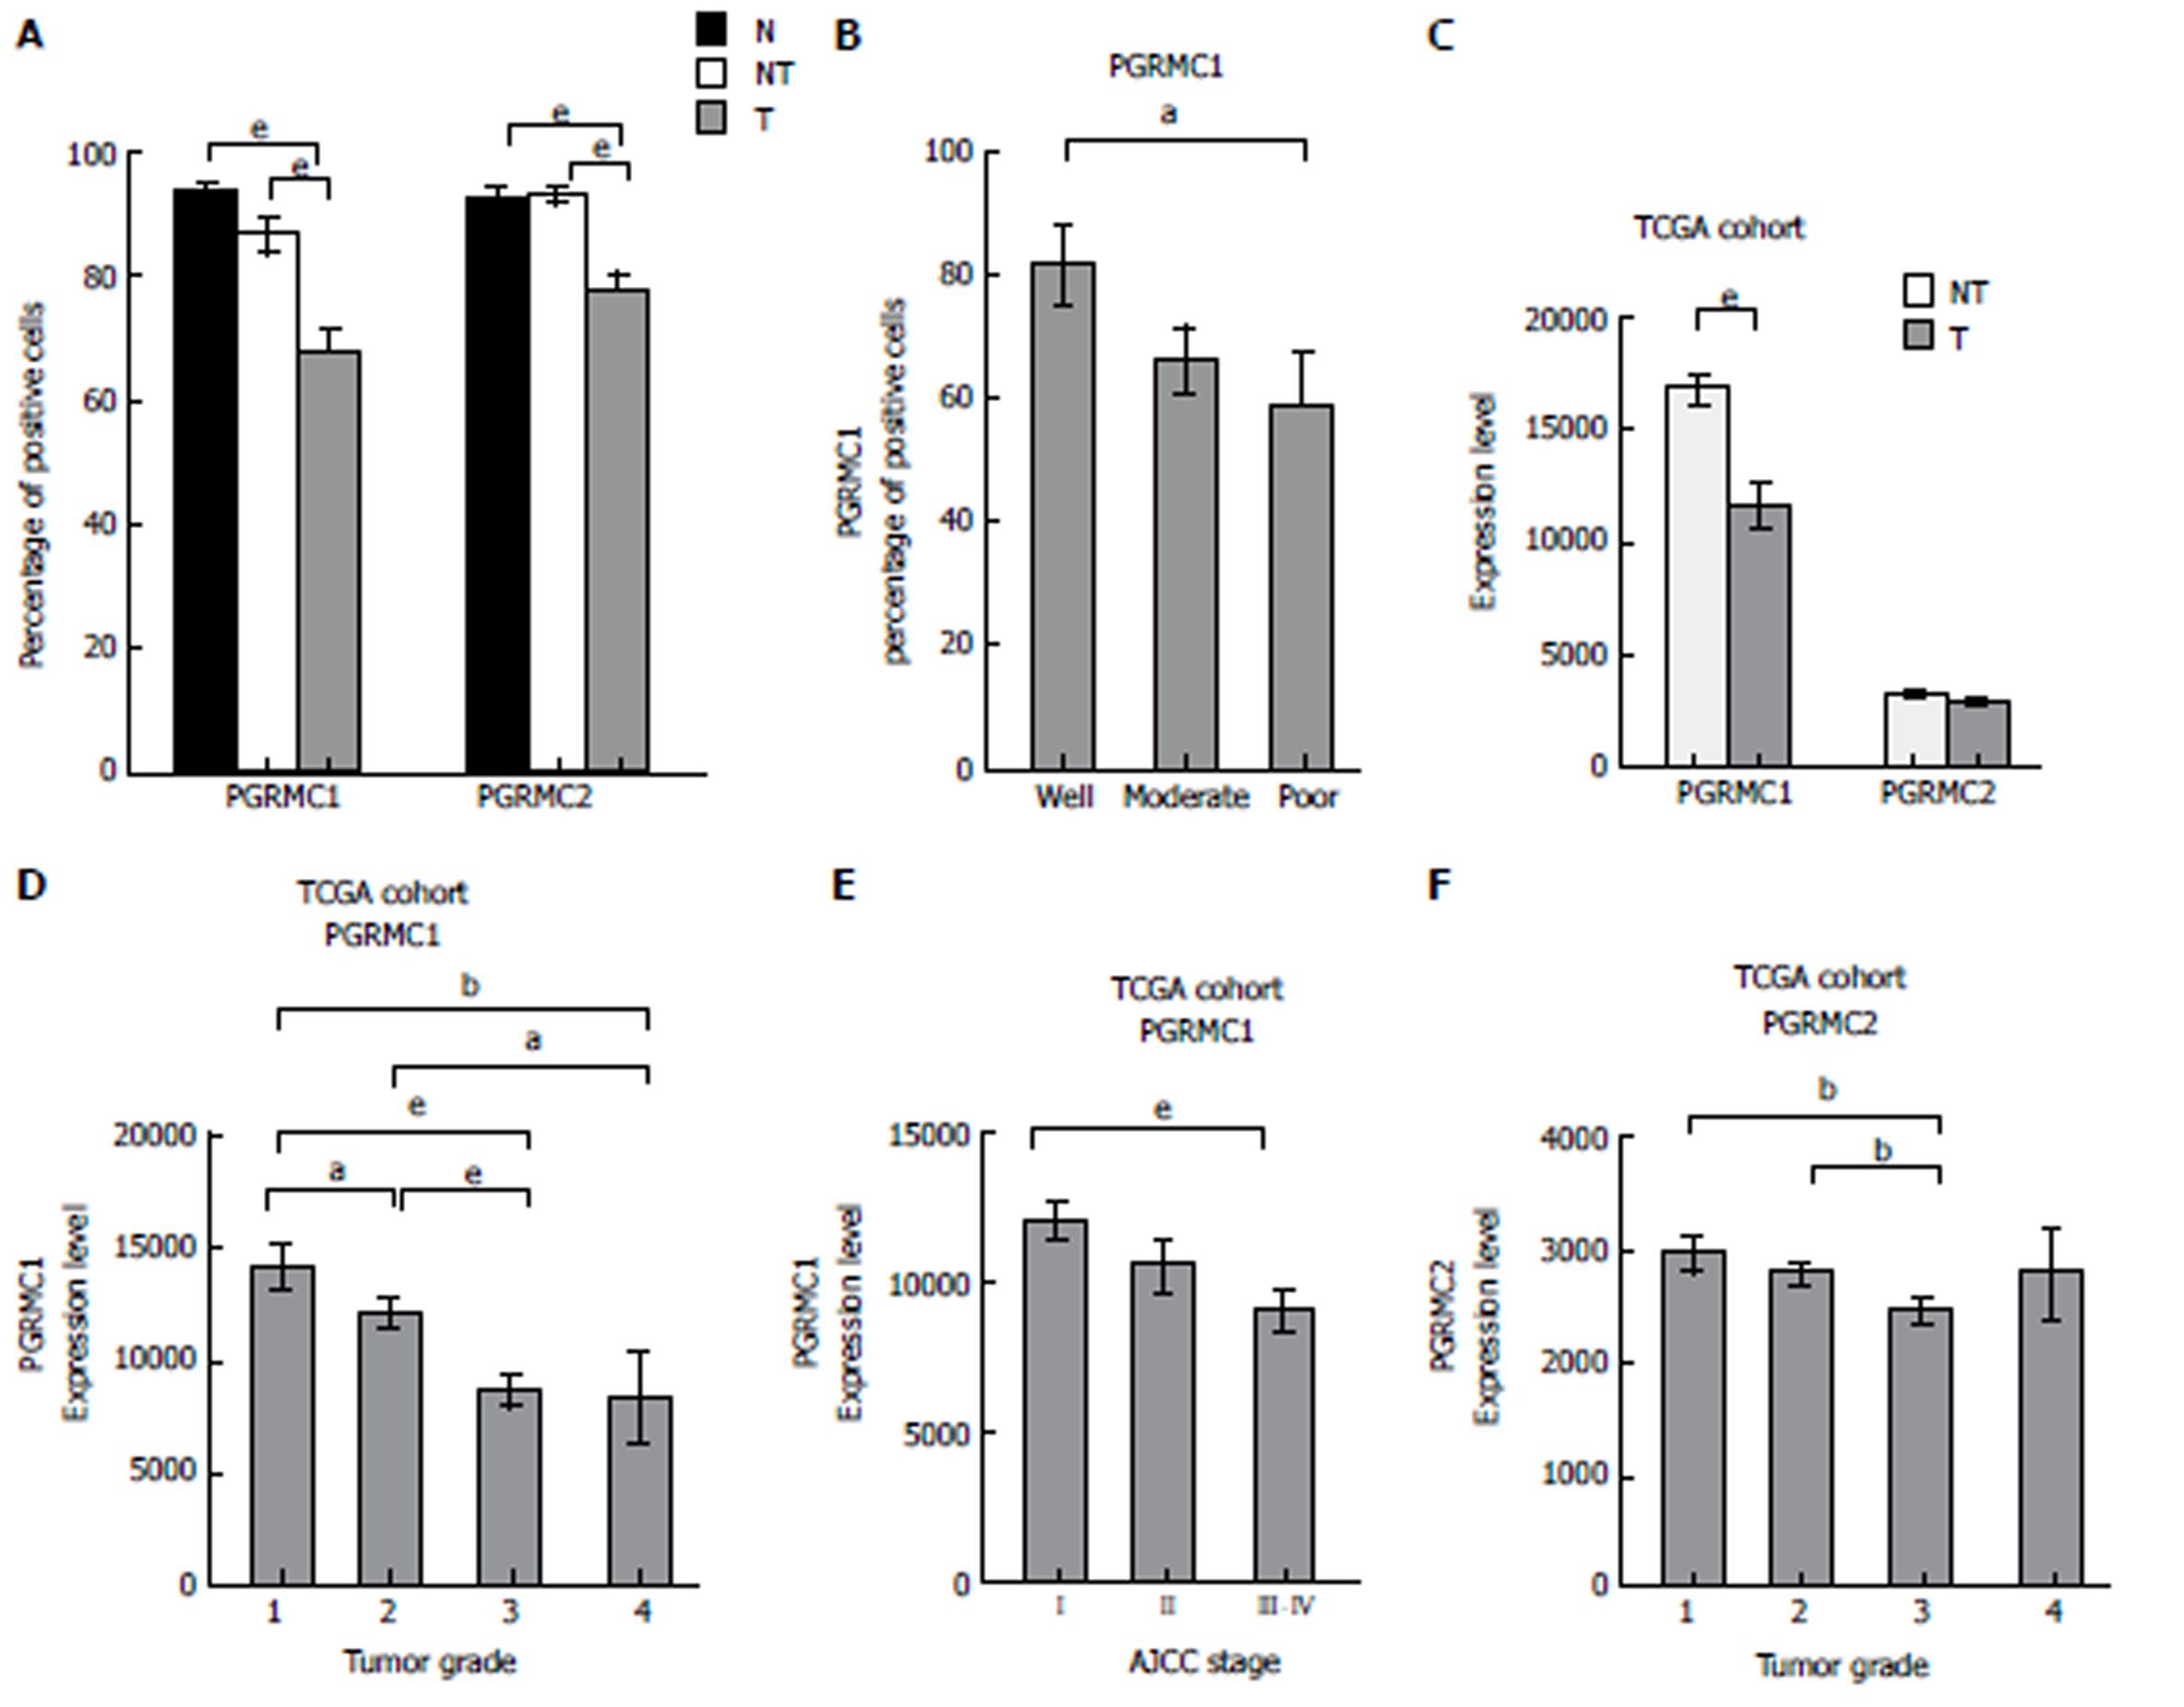
Figure 2 PGRMC1 and PGRMC2 expression levels, expressed as positive immunohistochemical staining percentages in the clinical cohort (A and B) and as normalized mRNA expression in the TCGA cohort (C-F).
A: A comparison of PGRMC1 and PGRMC2 staining in HCC (T), non-tumor liver (NT) and normal liver (N) tissue samples; B: A comparison of PGRMC1 staining in HCC samples with different degrees of tumor differentiation; C: A comparison of PGRMC1 and PGRMC2 mRNA expression levels in HCC (T) and non-tumor liver (NT) samples; D: A comparison of PGRMC1 mRNA expression levels in HCC samples with different tumor grades; E: A comparison of PGRMC1 mRNA expression levels in HCC samples with different tumor stages; F: A comparison of PGRMC2 mRNA expression levels in HCC samples with different tumor grades. aP < 0.05, bP < 0.01, eP < 0.001.
- Citation: Tsai HW, Ho CL, Cheng SW, Lin YJ, Chen CC, Cheng PN, Yen CJ, Chang TT, Chiang PM, Chan SH, Ho CH, Chen SH, Wang YW, Chow NH, Lin JC. Progesterone receptor membrane component 1 as a potential prognostic biomarker for hepatocellular carcinoma. World J Gastroenterol 2018; 24(10): 1152-1166
- URL: https://www.wjgnet.com/1007-9327/full/v24/i10/1152.htm
- DOI: https://dx.doi.org/10.3748/wjg.v24.i10.1152


