Copyright
©The Author(s) 2018.
World J Gastroenterol. Mar 14, 2018; 24(10): 1107-1119
Published online Mar 14, 2018. doi: 10.3748/wjg.v24.i10.1107
Published online Mar 14, 2018. doi: 10.3748/wjg.v24.i10.1107
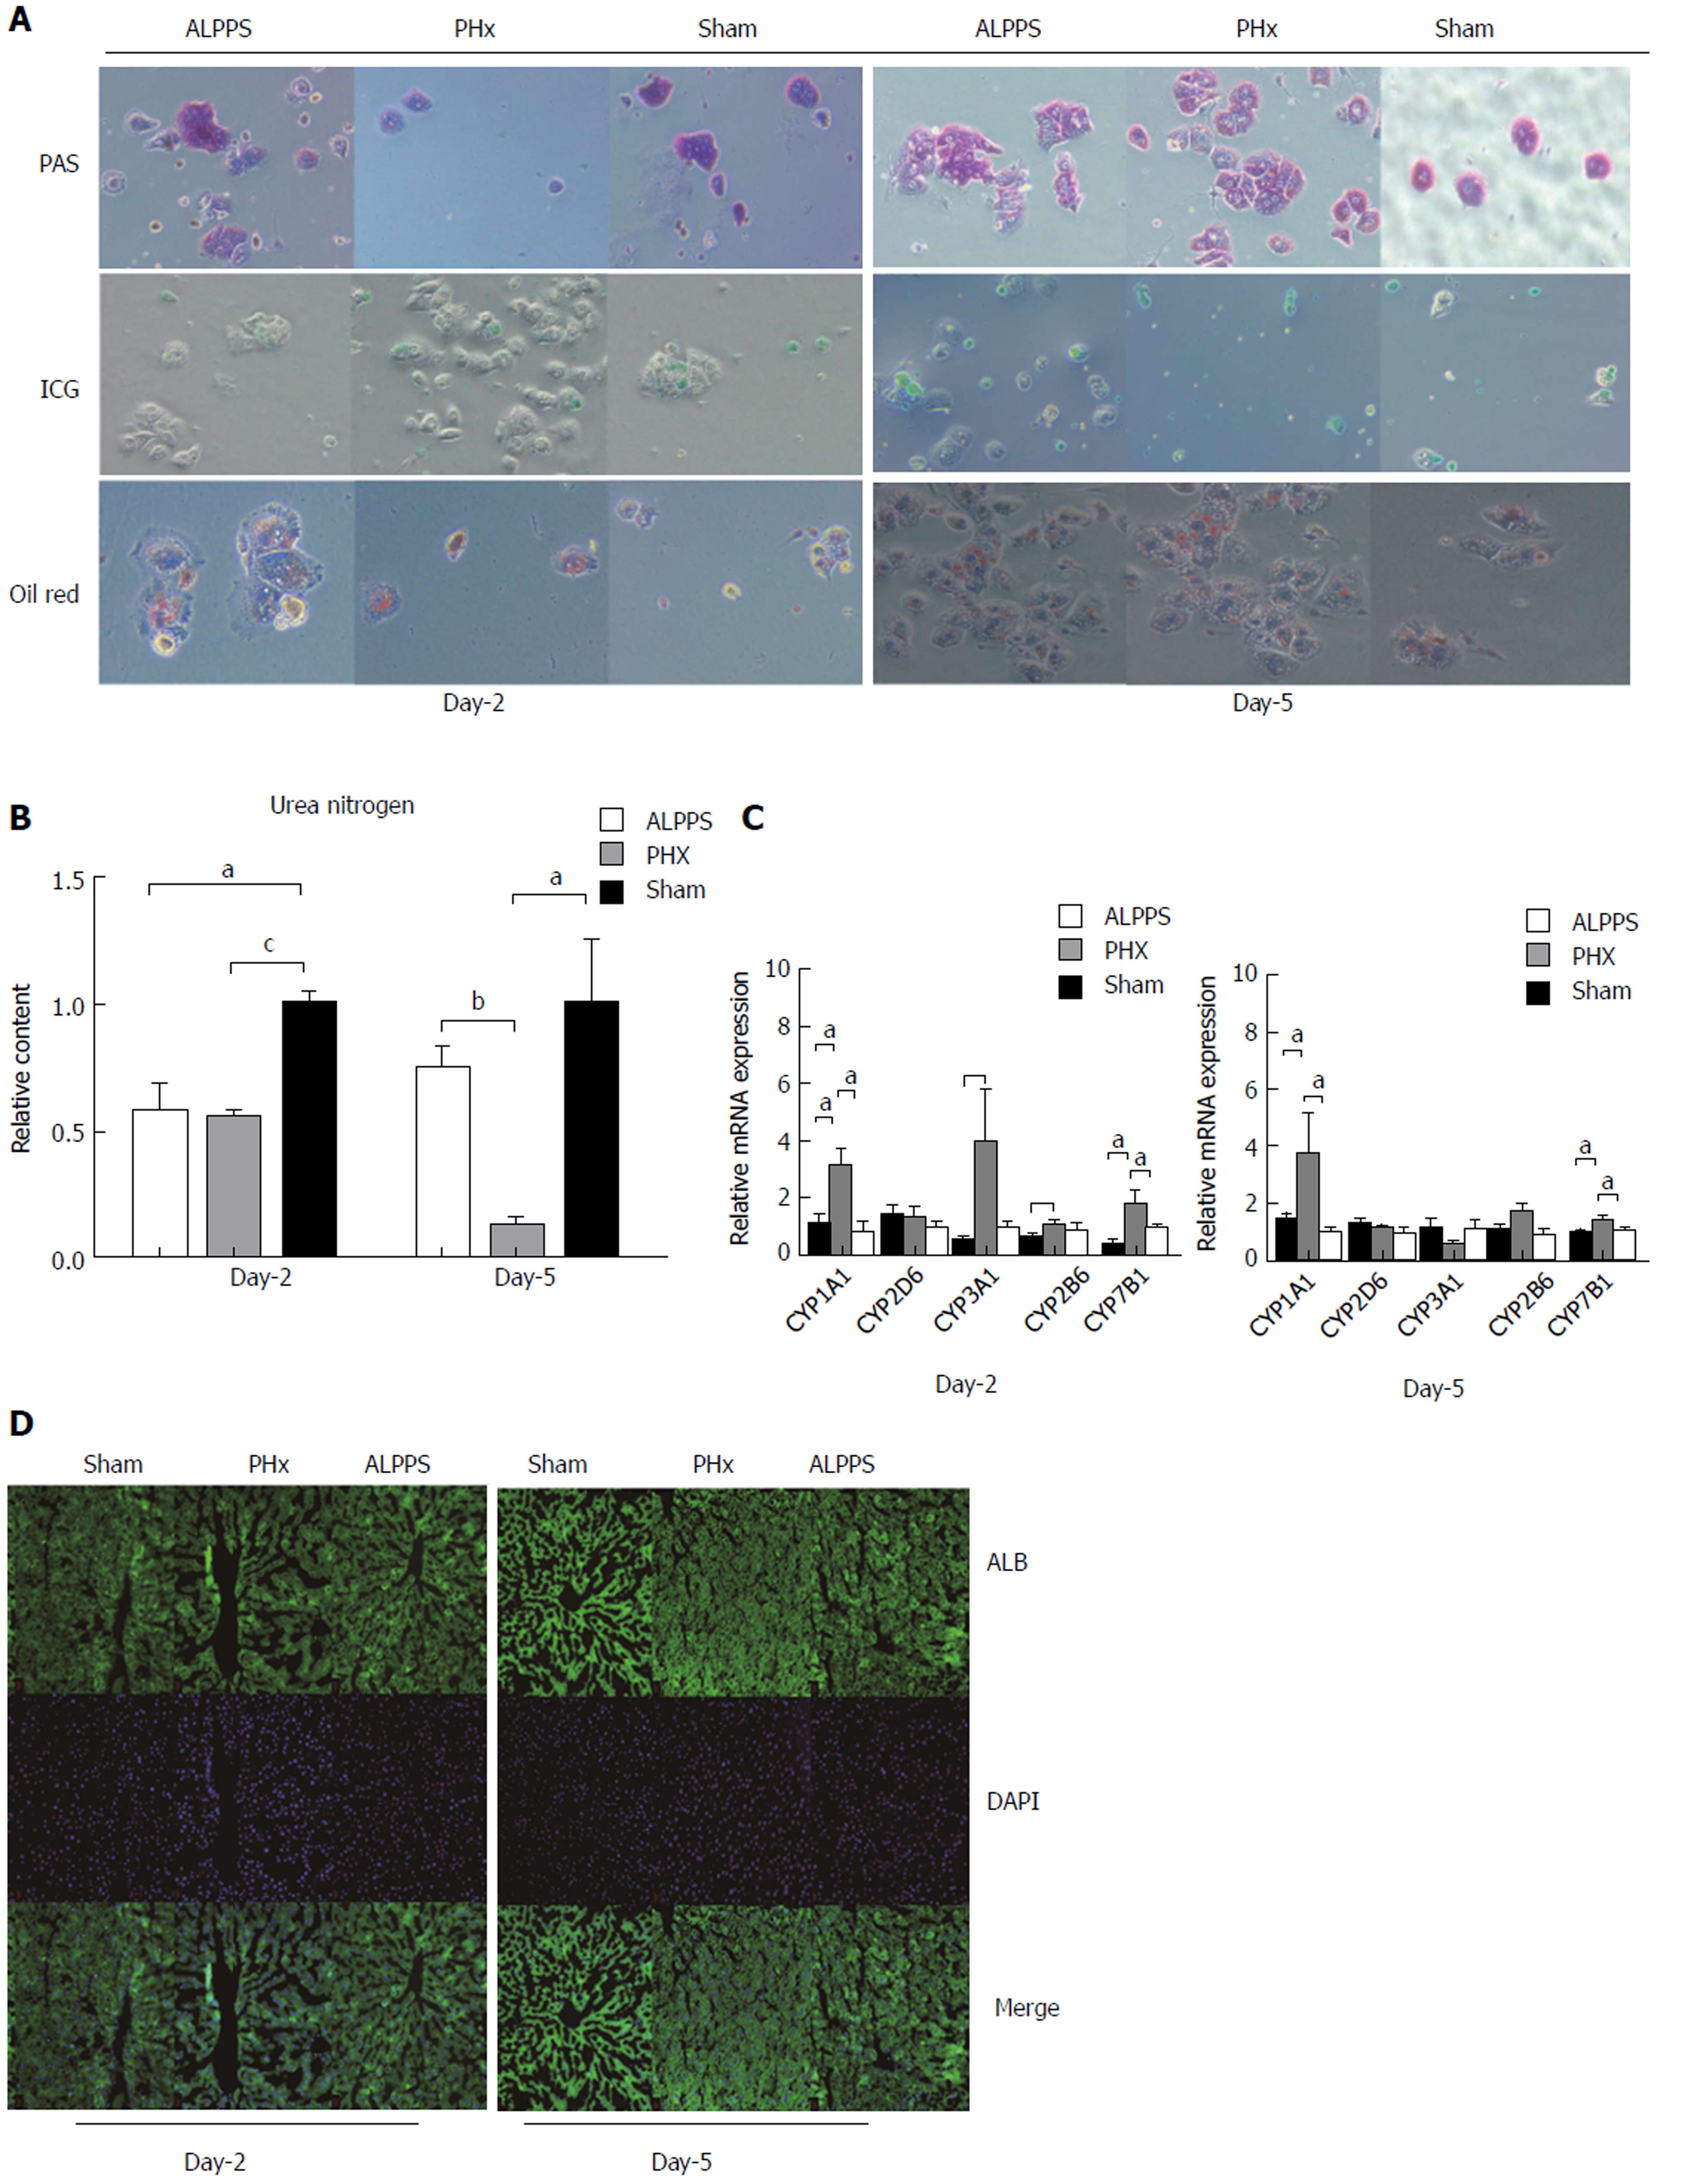
Figure 4 Hepatocytes function.
A: Glycogen storage was assayed by PAS staining; Fat storage was assayed by OilRed staining; ICG uptake in cells of different groups (green staining); B: P450Y enzymes expression at RNA level; C: The synthesis of Urea nitrogen of ALPPS, PHx, sham groups at each time point; D: The protein level of albumin expression was measured by Immunofluorescence. A: ALPPS; P/PHx: Partial hepatectomy; S: Sham. aP < 0.05, bP < 0.01, cP < 0.001.
- Citation: Tong YF, Meng N, Chen MQ, Ying HN, Xu M, Lu B, Hong JJ, Wang YF, Cai XJ. Maturity of associating liver partition and portal vein ligation for staged hepatectomy-derived liver regeneration in a rat model. World J Gastroenterol 2018; 24(10): 1107-1119
- URL: https://www.wjgnet.com/1007-9327/full/v24/i10/1107.htm
- DOI: https://dx.doi.org/10.3748/wjg.v24.i10.1107


