Copyright
©The Author(s) 2018.
World J Gastroenterol. Mar 14, 2018; 24(10): 1093-1106
Published online Mar 14, 2018. doi: 10.3748/wjg.v24.i10.1093
Published online Mar 14, 2018. doi: 10.3748/wjg.v24.i10.1093
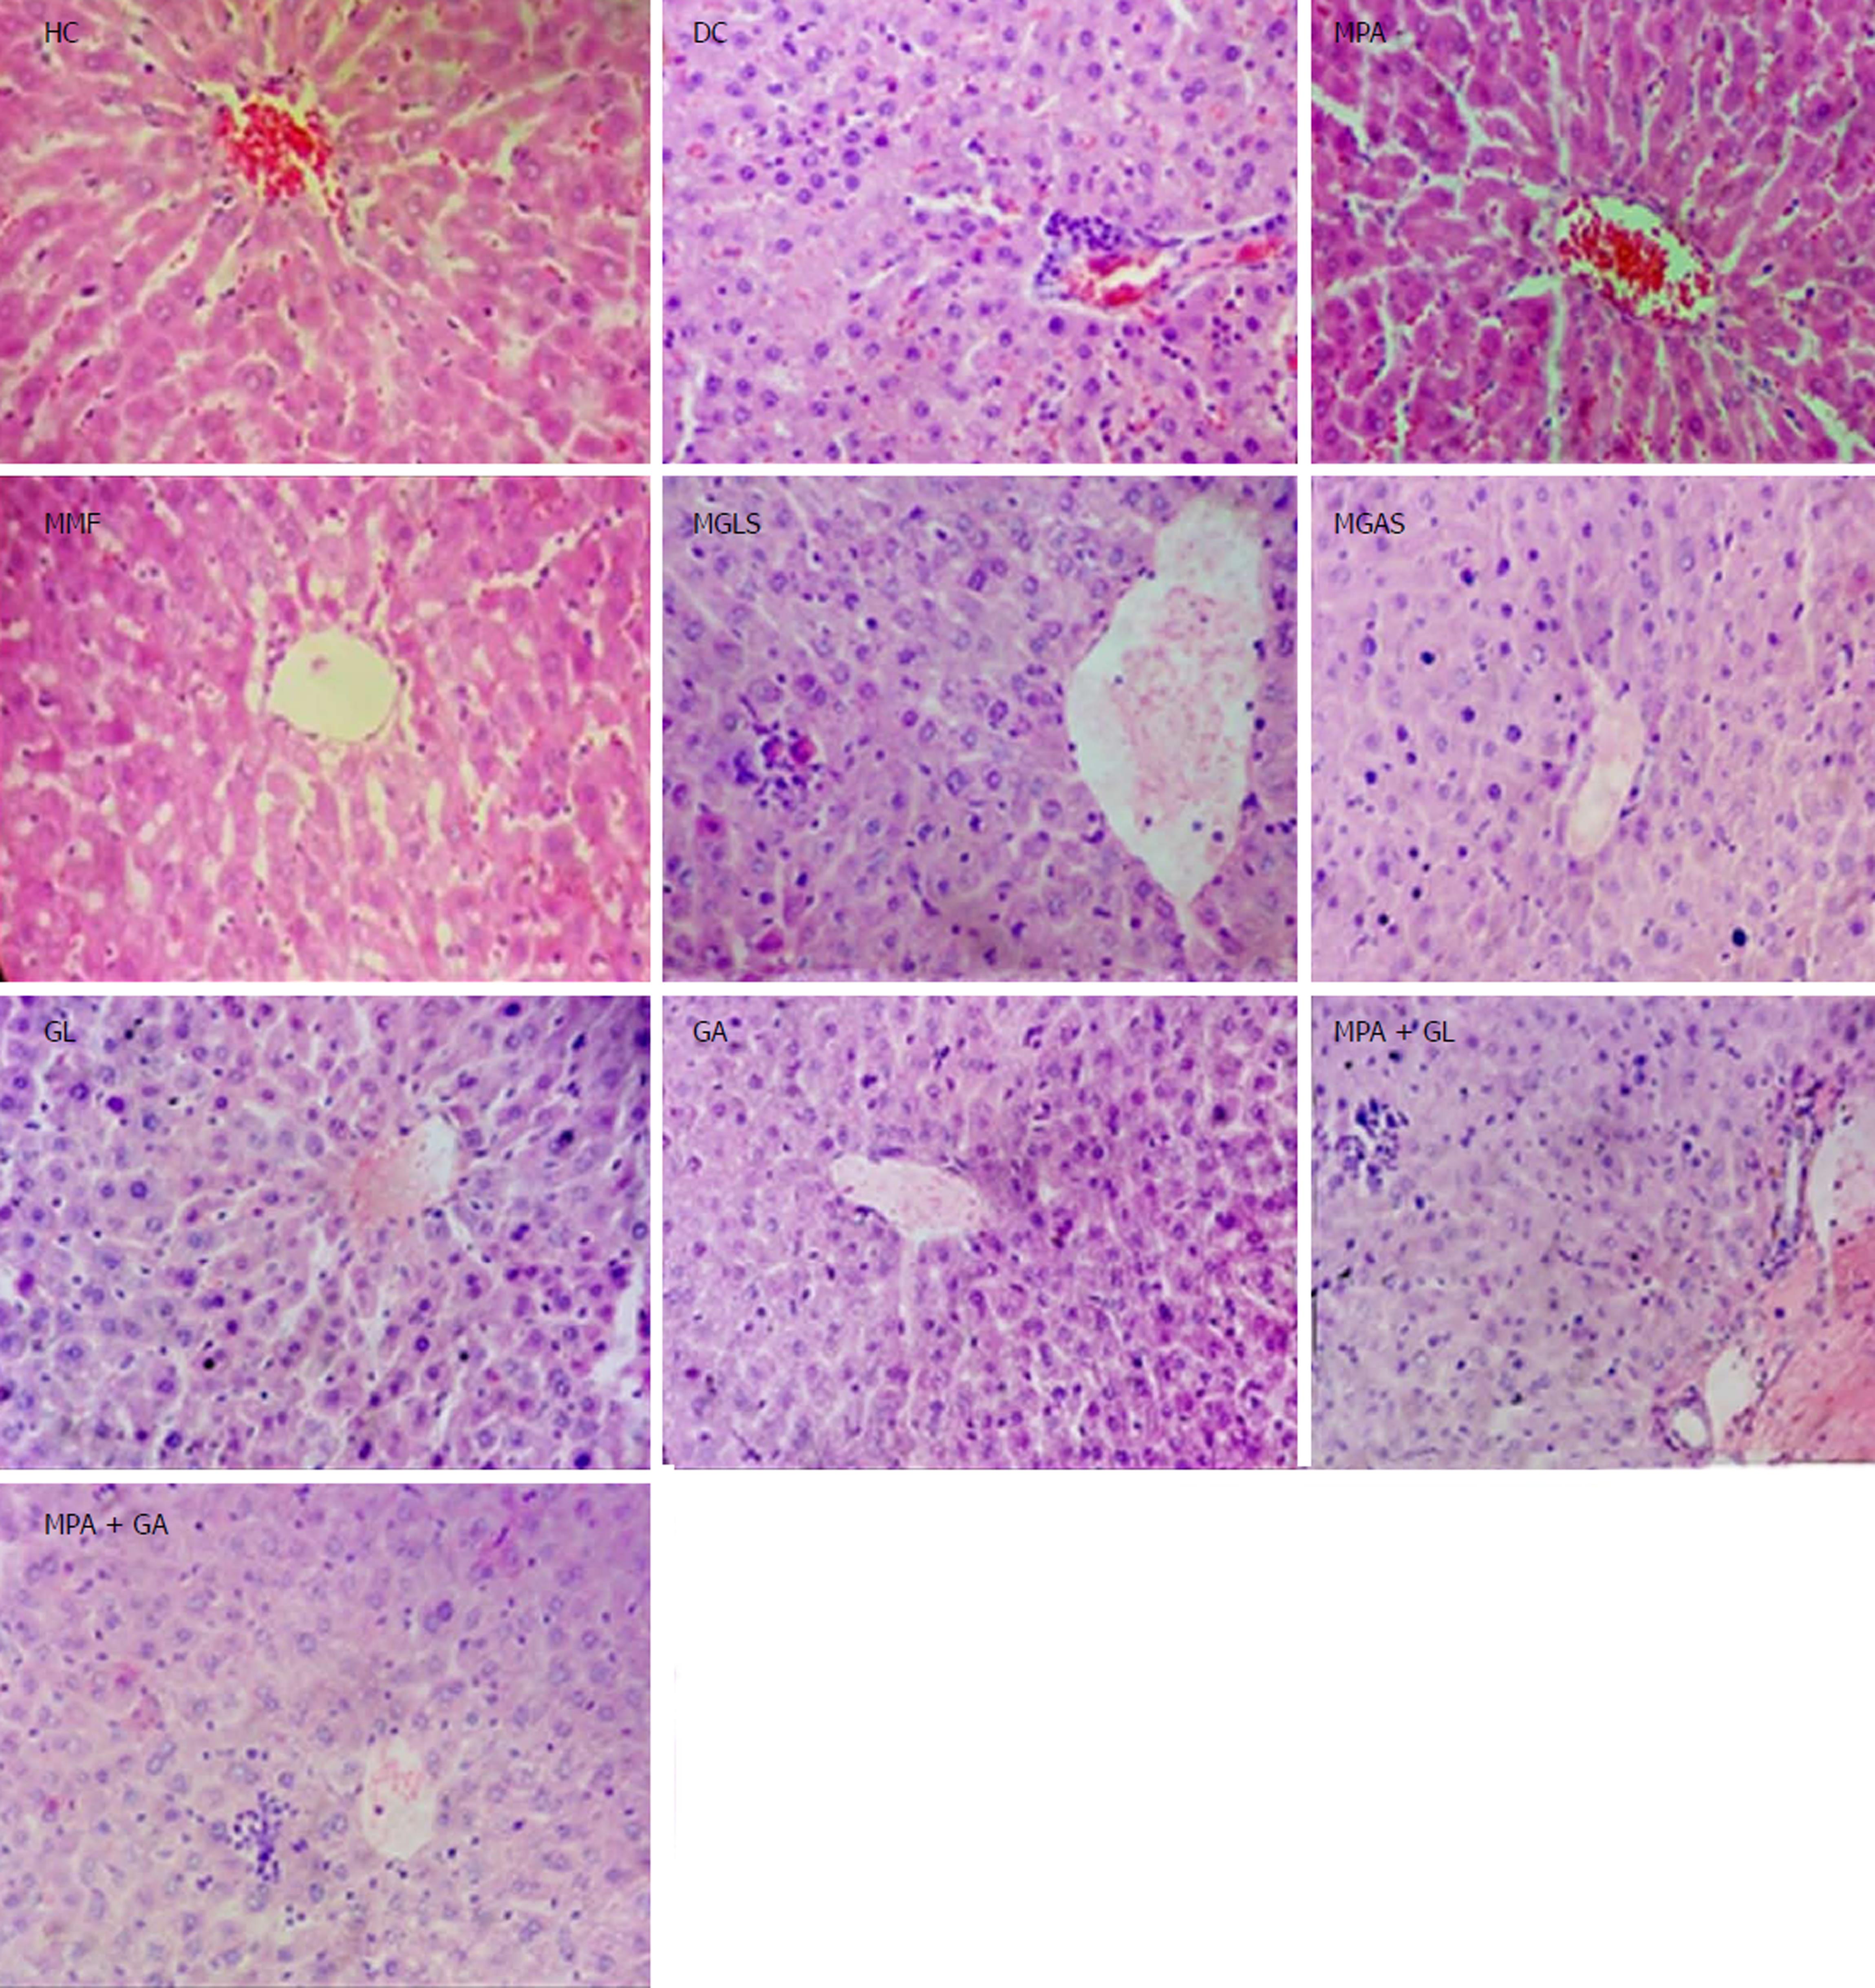
Figure 9 Photomicrographs of liver.
HC: Healthy control; DC: Disease control showing minimal degeneration of hepatocytes and congestion of blood vessels; MPA: MPA showing normal liver architecture; MMF: MMF Showing normal liver architecture; MGLS: Prodrug of MPA and D-glucosamine showing minimal infiltration of inflammatory cells; MGAS: Prodrug of MPA and D-galactosamine showing mild infiltration of inflammatory cells; GL: D-Glucosamine showing minimal infiltration of inflammatory cells; GA: D-galactosamine showing minimal infiltration of inflammatory cells; MPA + GL: Physical mixture of D-glucosamine and MPA showing minimal infiltration of inflammatory cells; MPA + GA: Physical mixture of D-galactosamine and MPA showing mild infiltration of inflammatory cells.
- Citation: Chopade SS, Dhaneshwar SS. Determination of the mitigating effect of colon-specific bioreversible codrugs of mycophenolic acid and aminosugars in an experimental colitis model in Wistar rats. World J Gastroenterol 2018; 24(10): 1093-1106
- URL: https://www.wjgnet.com/1007-9327/full/v24/i10/1093.htm
- DOI: https://dx.doi.org/10.3748/wjg.v24.i10.1093


