Copyright
©The Author(s) 2017.
World J Gastroenterol. Feb 21, 2017; 23(7): 1189-1202
Published online Feb 21, 2017. doi: 10.3748/wjg.v23.i7.1189
Published online Feb 21, 2017. doi: 10.3748/wjg.v23.i7.1189
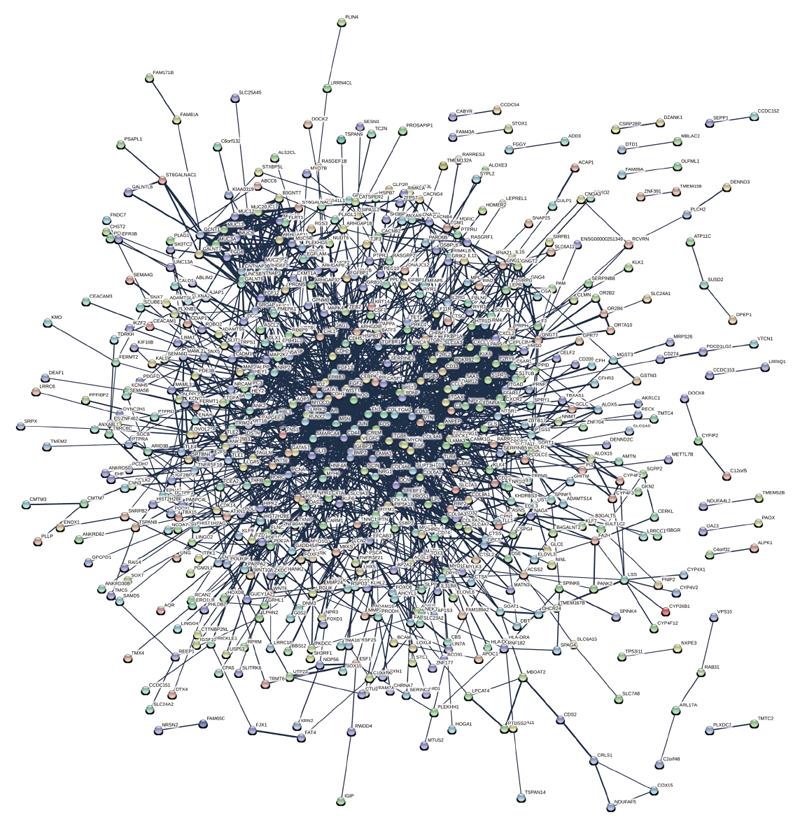
Figure 6 Interaction network analyses of differentially express proteins.
In the network, nodes represents proteins, lines as functional associations between the abnormal expressed proteins and the thickness of the lines indicates the level of confidence in association reported.
- Citation: Xie XQ, Zhao QH, Wang H, Gu KS. Dysregulation of mRNA profile in cisplatin-resistant gastric cancer cell line SGC7901. World J Gastroenterol 2017; 23(7): 1189-1202
- URL: https://www.wjgnet.com/1007-9327/full/v23/i7/1189.htm
- DOI: https://dx.doi.org/10.3748/wjg.v23.i7.1189


