Copyright
©The Author(s) 2017.
World J Gastroenterol. Feb 21, 2017; 23(7): 1189-1202
Published online Feb 21, 2017. doi: 10.3748/wjg.v23.i7.1189
Published online Feb 21, 2017. doi: 10.3748/wjg.v23.i7.1189
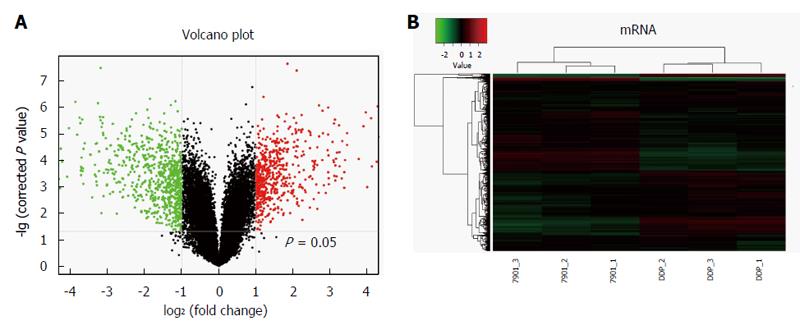
Figure 2 mRNA expression levels from microarray.
A: The volcano plot image showed the mRNA expression levels of microarray in SGC7901/DDP cells compared with SGC7901 cells. Black dots: equally expressed mRNAs between SGC7901/DDP cells and SGC7901 cells (FC ≤ 2); red dots: mRNAs were over-expressed in SGC7901/DDP cells compared with SGC7901 cells (FC ≥ 2); green dots: mRNAs in SGC7901/DDP cells were down-expressed compared to SGC7901 cells (P-values < 0.05, FC ≥ 2). Fold changes of these mRNAs in SGC7901/DDP cells compared with SGC7901 cells are shown as mean ± SD; B: Two-dimensional hierarchical clustering image of the 1308 dysregulated mRNAs in the SGC7901/DDP cells compared with the SGC7901 cells, each row represents an mRNA, each column represents a sample. 7901-1, 7901-2 and 7901-3 represent the three samples of SGC7901 cells, DDP-1, DDP-2 and DDP-3 represent the three samples of SGC7901/DDP cells. Red: Higher expression levels; green: Lower expression levels.
- Citation: Xie XQ, Zhao QH, Wang H, Gu KS. Dysregulation of mRNA profile in cisplatin-resistant gastric cancer cell line SGC7901. World J Gastroenterol 2017; 23(7): 1189-1202
- URL: https://www.wjgnet.com/1007-9327/full/v23/i7/1189.htm
- DOI: https://dx.doi.org/10.3748/wjg.v23.i7.1189


