Copyright
©The Author(s) 2017.
World J Gastroenterol. Feb 14, 2017; 23(6): 999-1009
Published online Feb 14, 2017. doi: 10.3748/wjg.v23.i6.999
Published online Feb 14, 2017. doi: 10.3748/wjg.v23.i6.999
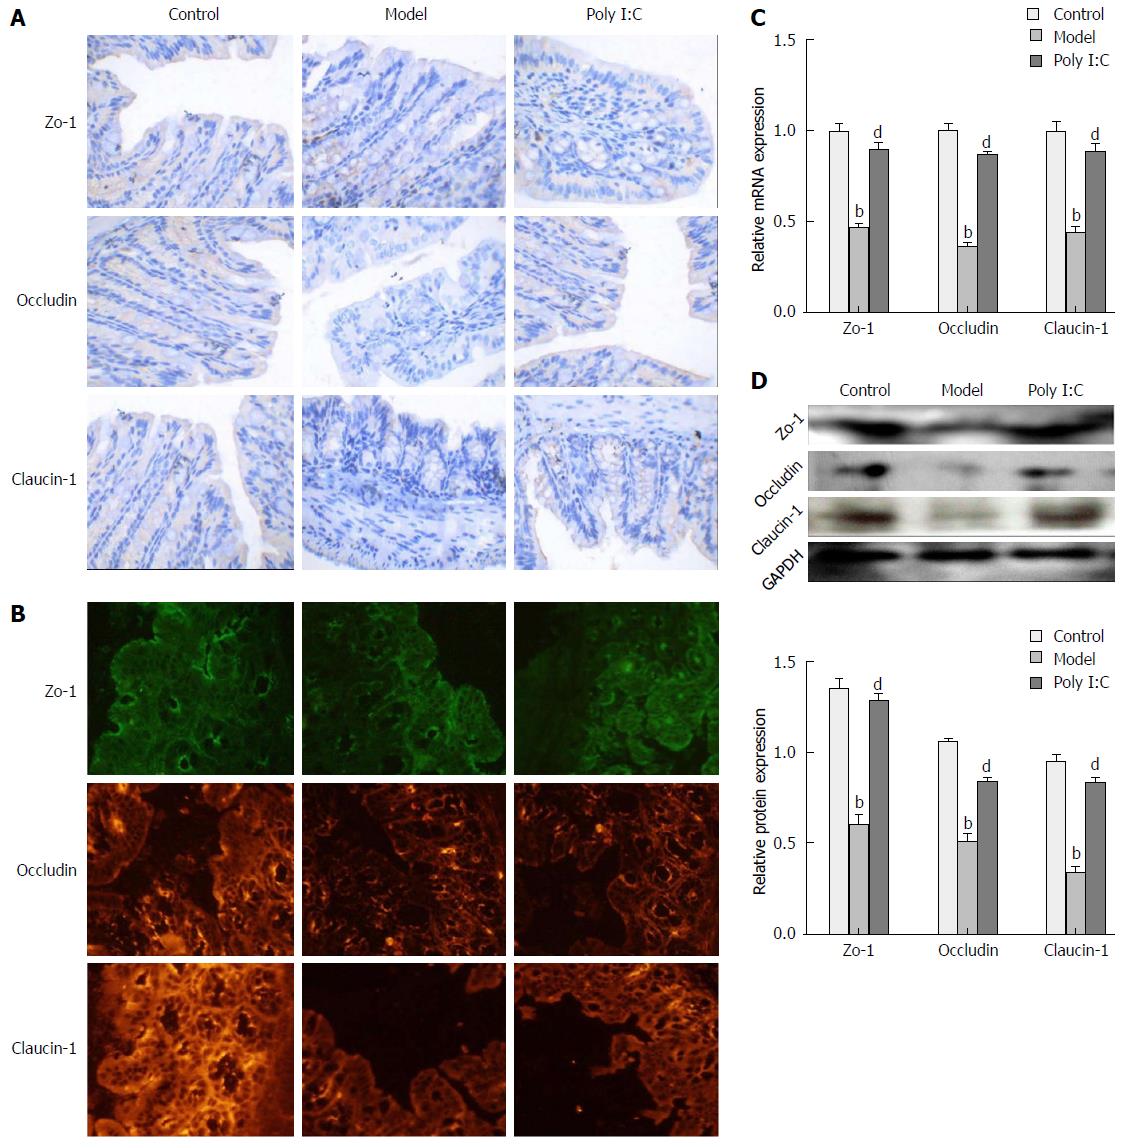
Figure 4 Effect of poly I:C on colonic epithelial junctions.
A: Representative photographs of immunohistochemistry staining for zo-1, occludin and claudin-1 (Magnification: × 200); B: Representative photographs of immunofluorescent staining for zo-1 (green), occludin and claudin-1 (red); C: Expressions of zo-1, occludin and clandin-1 at the mRNA level, as analyzed by RT-qPCR; D: Protein expressions of zo-1, occludin and clandin-1 as analyzed by Western Blot. Data are expressed as mean ± SD. bP < 0.01 vs control group; dP < 0.01 vs model group. RT-qPCR: Real-time quantitative polymerase chain reaction.
- Citation: Zhao HW, Yue YH, Han H, Chen XL, Lu YG, Zheng JM, Hou HT, Lang XM, He LL, Hu QL, Dun ZQ. Effect of toll-like receptor 3 agonist poly I:C on intestinal mucosa and epithelial barrier function in mouse models of acute colitis. World J Gastroenterol 2017; 23(6): 999-1009
- URL: https://www.wjgnet.com/1007-9327/full/v23/i6/999.htm
- DOI: https://dx.doi.org/10.3748/wjg.v23.i6.999


