Copyright
©The Author(s) 2017.
World J Gastroenterol. Feb 7, 2017; 23(5): 800-809
Published online Feb 7, 2017. doi: 10.3748/wjg.v23.i5.800
Published online Feb 7, 2017. doi: 10.3748/wjg.v23.i5.800
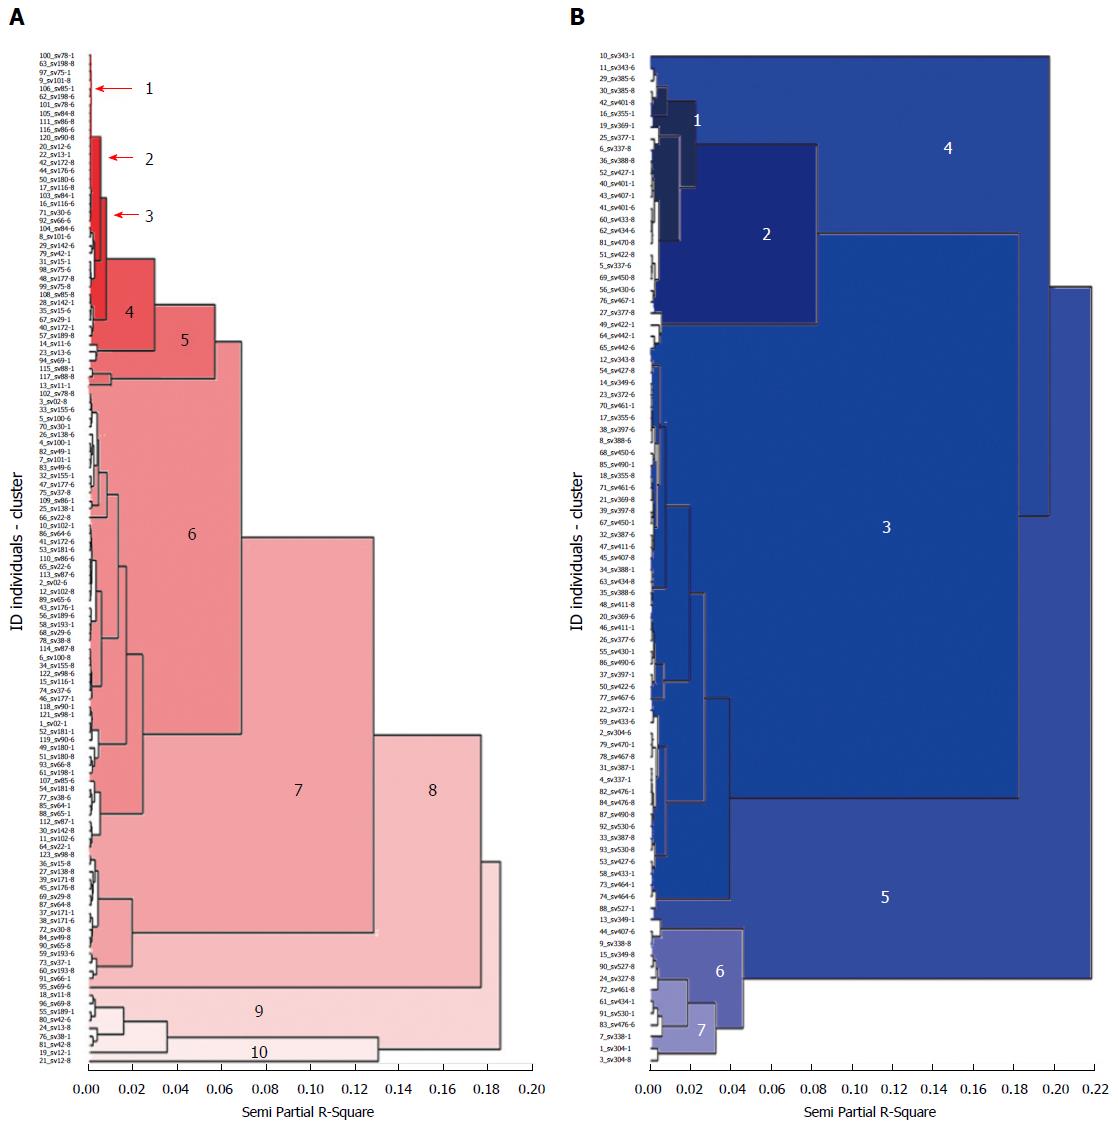
Figure 2 Dendrogram generated by the mixture of 1281 and 1254 DNA fingerprints in Helicobacter pylori isolates of patients from two Colombian regions with contrast risk of gastric cancer.
A: Low risk population of gastric cancer (GC) was formed by 10 groups (red) with a similarity coefficient of 0.07 less than the similarity (0.13) between isolates of the high risk population of gastric cancer, dendrogram B; B: In the high-risk population of gastric cancer 7 groups (blue) were formed, with greater genetic distance between population groups at risk of gastric cancer and with greater genetic variability of isolates of Helicobacter pylori (H. pylori). Cluster analyses were designed by following UPGMA clustering method and estimate of the distances between each pair of H. pylori isolated was calculated with the similarity of Neid. The fusions produced near to the origin of the scale (left) indicate that the cluster formed is quite homogeneous. Conversely, fusions produced on the final zone of the scale (right) indicate the cluster formed is quite heterogeneous.
- Citation: Matta AJ, Pazos AJ, Bustamante-Rengifo JA, Bravo LE. Genomic variability of Helicobacter pylori isolates of gastric regions from two Colombian populations. World J Gastroenterol 2017; 23(5): 800-809
- URL: https://www.wjgnet.com/1007-9327/full/v23/i5/800.htm
- DOI: https://dx.doi.org/10.3748/wjg.v23.i5.800


