Copyright
©The Author(s) 2017.
World J Gastroenterol. Nov 7, 2017; 23(41): 7369-7386
Published online Nov 7, 2017. doi: 10.3748/wjg.v23.i41.7369
Published online Nov 7, 2017. doi: 10.3748/wjg.v23.i41.7369
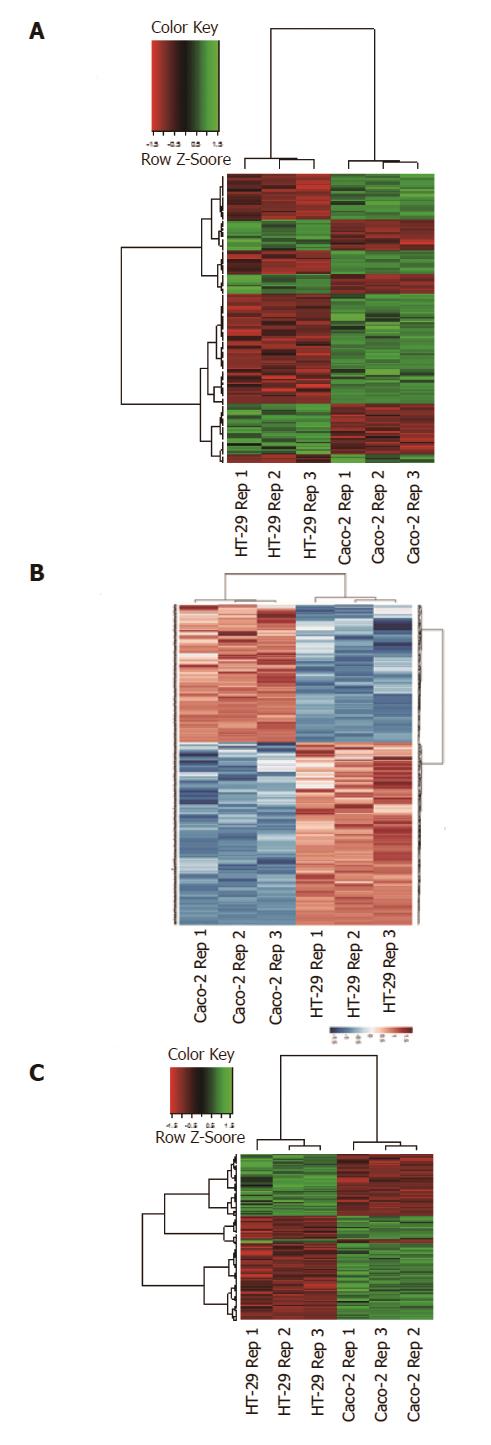
Figure 2 Bioinformatics QC analysis of HT-29 and Caco-2 replicates.
2-way hierarchical HCA clustering analysis on the HT-29 and Caco-2 cell line replicates using (A) DE miRNA probeset list (160 probesets) (B) DE proteomics list (168 proteins) and (C) DE mRNA probeset list (1795 probesets) confirms that the DE candidates separate the samples into their respective cell line replicate groups. For (A) and (C), red indicates diminished expression and green indicates increased expression for all three replicate groups; for (B) blue indicates diminished expression and red indicates increased expression for all three replicate groups.
- Citation: O’Sullivan F, Keenan J, Aherne S, O’Neill F, Clarke C, Henry M, Meleady P, Breen L, Barron N, Clynes M, Horgan K, Doolan P, Murphy R. Parallel mRNA, proteomics and miRNA expression analysis in cell line models of the intestine. World J Gastroenterol 2017; 23(41): 7369-7386
- URL: https://www.wjgnet.com/1007-9327/full/v23/i41/7369.htm
- DOI: https://dx.doi.org/10.3748/wjg.v23.i41.7369


