Copyright
©The Author(s) 2017.
World J Gastroenterol. Nov 7, 2017; 23(41): 7347-7358
Published online Nov 7, 2017. doi: 10.3748/wjg.v23.i41.7347
Published online Nov 7, 2017. doi: 10.3748/wjg.v23.i41.7347
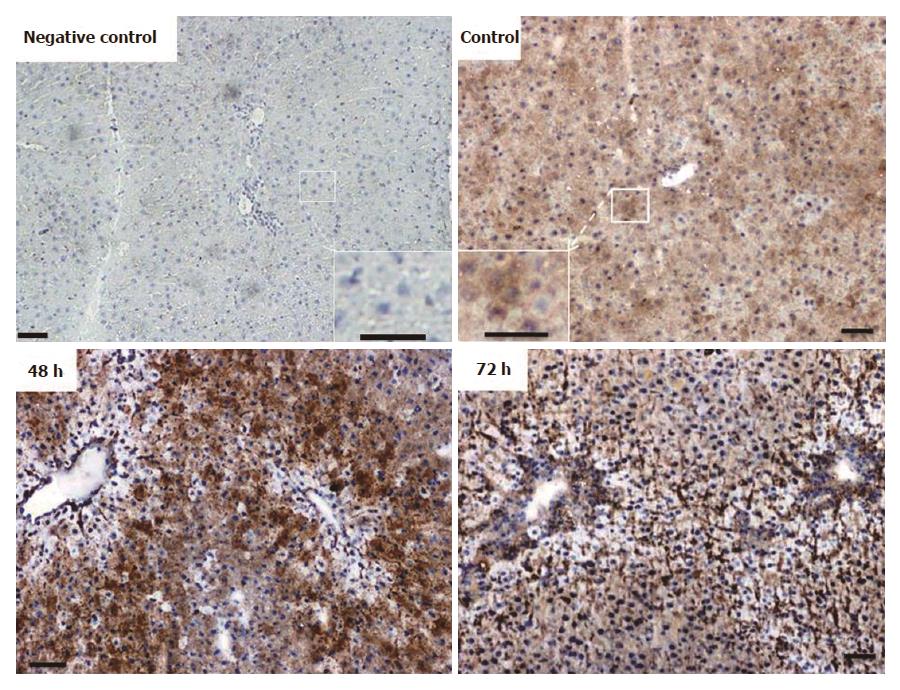
Figure 5 Immunoperoxidase staining of ferritin light chain in cryostat sections of rat liver from control and thioacetamide-injected animals.
Insets show higher magnification of corresponding areas. Negative control represents the omission of primary antibodies. Note massive increase in signal intensity after 48 h and 72 h. Original magnification × 100; bar = 50 μm.
- Citation: Malik IA, Wilting J, Ramadori G, Naz N. Reabsorption of iron into acutely damaged rat liver: A role for ferritins. World J Gastroenterol 2017; 23(41): 7347-7358
- URL: https://www.wjgnet.com/1007-9327/full/v23/i41/7347.htm
- DOI: https://dx.doi.org/10.3748/wjg.v23.i41.7347


