Copyright
©The Author(s) 2017.
World J Gastroenterol. Sep 7, 2017; 23(33): 6172-6180
Published online Sep 7, 2017. doi: 10.3748/wjg.v23.i33.6172
Published online Sep 7, 2017. doi: 10.3748/wjg.v23.i33.6172
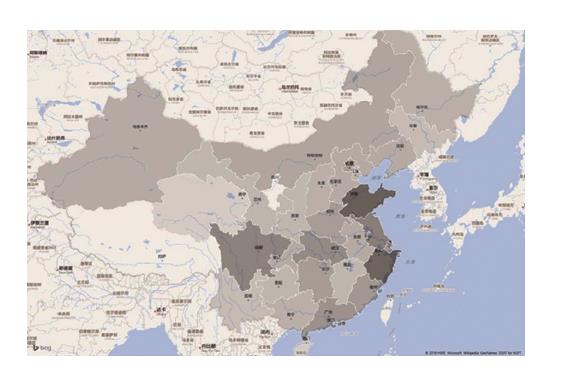
Figure 1 Demographic chart of the Chinese regions this survey covers.
The gray scale reflects the number of participants in each region, varying from 21 from Zhejiang to 1 from Hainan. Correlating with the number of colorectal surgeons in each region, more surgeons from the east regions participated in this survey. Tibet and Ningxia had no participants, which also corresponds to the fact that the number of surgeons is very limited compared to the east provinces. Due to the application of different medical systems in these regions, Hong Kong, Macao, and Taiwan were not included in this survey.
- Citation: van Rooijen SJ, Jongen AC, Wu ZQ, Ji JF, Slooter GD, Roumen RM, Bouvy ND. Definition of colorectal anastomotic leakage: A consensus survey among Dutch and Chinese colorectal surgeons. World J Gastroenterol 2017; 23(33): 6172-6180
- URL: https://www.wjgnet.com/1007-9327/full/v23/i33/6172.htm
- DOI: https://dx.doi.org/10.3748/wjg.v23.i33.6172


