Copyright
©The Author(s) 2017.
World J Gastroenterol. Sep 7, 2017; 23(33): 6155-6163
Published online Sep 7, 2017. doi: 10.3748/wjg.v23.i33.6155
Published online Sep 7, 2017. doi: 10.3748/wjg.v23.i33.6155
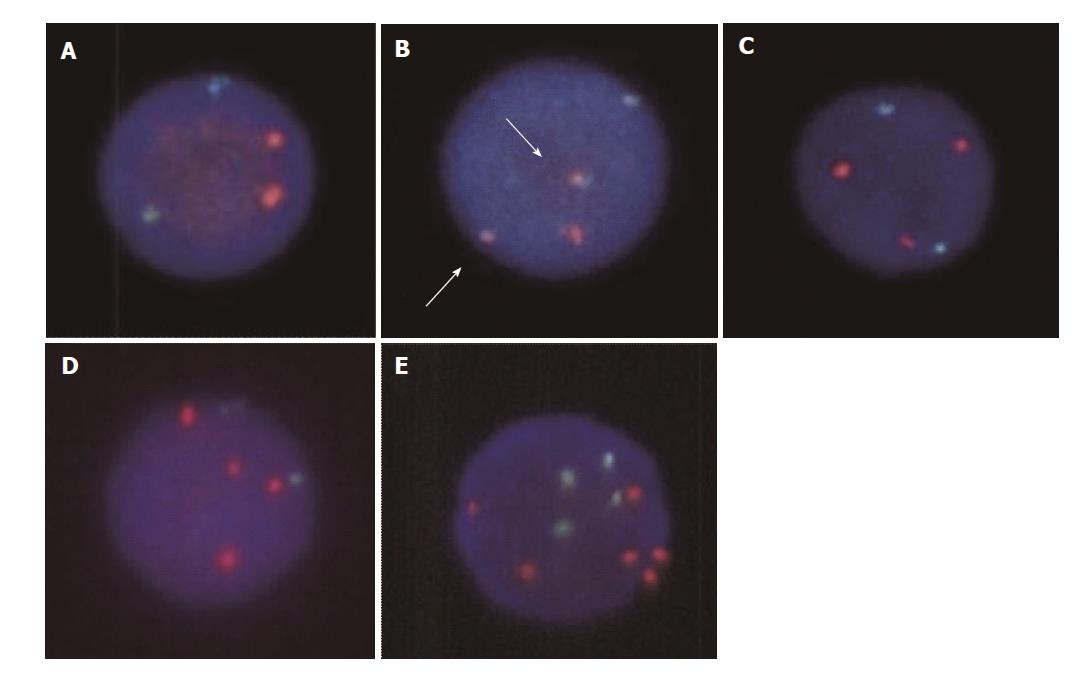
Figure 1 FISH images of the lymphoma cells.
In the FISH analysis for t(11;18)(q21; q21) translocation, API2 is visualized as a green signal and MALT1 as a red signal. A: Two green signals and two red signals are seen in cases without t(11;18) translocation or extra copies of MALT1. B: Fusion genes of API2-MALT1 are detected as yellow signals, indicating t(11;18) translocation (B, arrows). C: Although no fusion genes are visible, an extra copy of MALT1 is noted, indicating trisomy 18. D: Two extra copies of MALT1 are visible, indicating tetrasomy 18. E: In one patient, several lymphoma cells have six MALT1 signals with four API2 signals, which is considered as trisomy 18 with tetraploidy.
- Citation: Iwamuro M, Takenaka R, Nakagawa M, Moritou Y, Saito S, Hori S, Inaba T, Kawai Y, Toyokawa T, Tanaka T, Yoshino T, Okada H. Management of gastric mucosa-associated lymphoid tissue lymphoma in patients with extra copies of the MALT1 gene. World J Gastroenterol 2017; 23(33): 6155-6163
- URL: https://www.wjgnet.com/1007-9327/full/v23/i33/6155.htm
- DOI: https://dx.doi.org/10.3748/wjg.v23.i33.6155


