Copyright
©The Author(s) 2017.
World J Gastroenterol. Aug 21, 2017; 23(31): 5680-5691
Published online Aug 21, 2017. doi: 10.3748/wjg.v23.i31.5680
Published online Aug 21, 2017. doi: 10.3748/wjg.v23.i31.5680
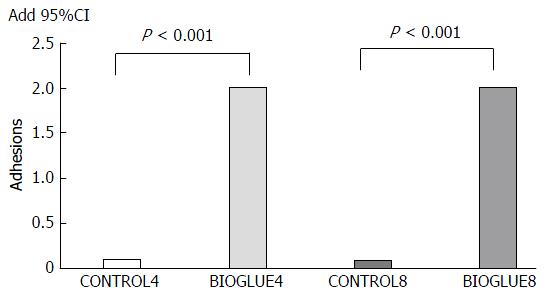
Figure 4 Comparative bar chart of adhesion formation (mean).
The adhesion formation score was statistically significantly higher in both Bioglue subgroups compared to control.
- Citation: Despoudi K, Mantzoros I, Ioannidis O, Cheva A, Antoniou N, Konstantaras D, Symeonidis S, Pramateftakis MG, Kotidis E, Angelopoulos S, Tsalis K. Effects of albumin/glutaraldehyde glue on healing of colonic anastomosis in rats. World J Gastroenterol 2017; 23(31): 5680-5691
- URL: https://www.wjgnet.com/1007-9327/full/v23/i31/5680.htm
- DOI: https://dx.doi.org/10.3748/wjg.v23.i31.5680


