Copyright
©The Author(s) 2017.
World J Gastroenterol. Aug 7, 2017; 23(29): 5333-5344
Published online Aug 7, 2017. doi: 10.3748/wjg.v23.i29.5333
Published online Aug 7, 2017. doi: 10.3748/wjg.v23.i29.5333
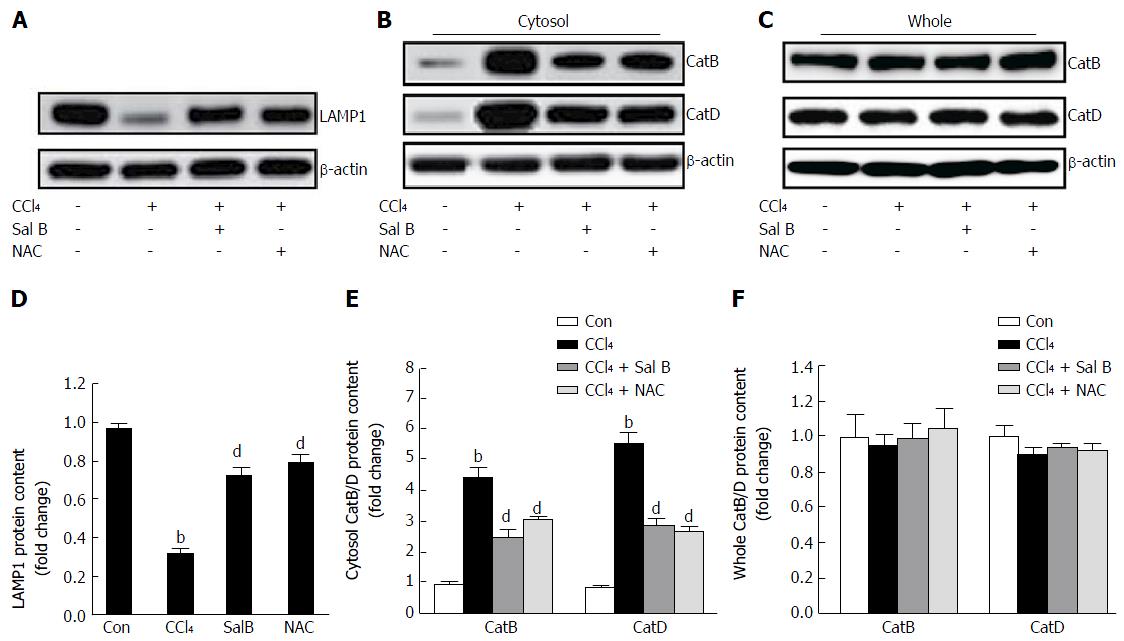
Figure 8 Effect of Sal B on LAMP1 and leakage of CatB to the cytosol.
A: Expressions of LAMP1 in liver detected by western blot; B, C: CatB/D levels in the cytosol/whole lysate were measured by western blot; D: Quantitative analysis of optical densities of LAMP1 and normalized to the expression of β-actin. E, F: Quantitative analysis of optical densities of CatB/D in the cytosol/whole lysate and normalized to the expression of β-actin. All data are presented as mean ± SD. Statistical analysis was performed using Student’s t-test (bP < 0.01 vs Con; dP < 0.01 vs CCl4).
- Citation: Yan XF, Zhao P, Ma DY, Jiang YL, Luo JJ, Liu L, Wang XL. Salvianolic acid B protects hepatocytes from H2O2 injury by stabilizing the lysosomal membrane. World J Gastroenterol 2017; 23(29): 5333-5344
- URL: https://www.wjgnet.com/1007-9327/full/v23/i29/5333.htm
- DOI: https://dx.doi.org/10.3748/wjg.v23.i29.5333


