Copyright
©The Author(s) 2017.
World J Gastroenterol. Jun 21, 2017; 23(23): 4211-4221
Published online Jun 21, 2017. doi: 10.3748/wjg.v23.i23.4211
Published online Jun 21, 2017. doi: 10.3748/wjg.v23.i23.4211
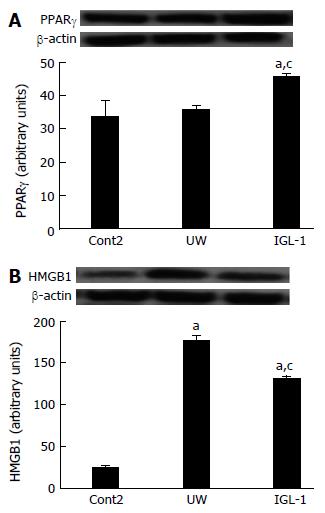
Figure 4 PPARγ and HMGB-1 protein levels after reperfusion.
Representative Western blot at the top and densitometric analysis at the bottom of protein levels of PPARγ (A) and HMGB-1 (B) in steatotic liver grafts. aP < 0.05 vs Cont2, cP < 0.05 vs UW. Cont2: Liver flushed and perfused ex vivo without cold preservation; UW: Liver preserved in UW solution; IGL-1: Liver preserved in IGL-1 solution; UW: University of Wisconsin; IGL-1: Institut Georges Lopez-1.
- Citation: Zaouali MA, Panisello-Roselló A, Lopez A, Castro Benítez C, Folch-Puy E, García-Gil A, Carbonell T, Adam R, Roselló-Catafau J. Relevance of proteolysis and proteasome activation in fatty liver graft preservation: An Institut Georges Lopez-1 vs University of Wisconsin appraisal. World J Gastroenterol 2017; 23(23): 4211-4221
- URL: https://www.wjgnet.com/1007-9327/full/v23/i23/4211.htm
- DOI: https://dx.doi.org/10.3748/wjg.v23.i23.4211


