Copyright
©The Author(s) 2017.
World J Gastroenterol. Jan 14, 2017; 23(2): 336-344
Published online Jan 14, 2017. doi: 10.3748/wjg.v23.i2.336
Published online Jan 14, 2017. doi: 10.3748/wjg.v23.i2.336
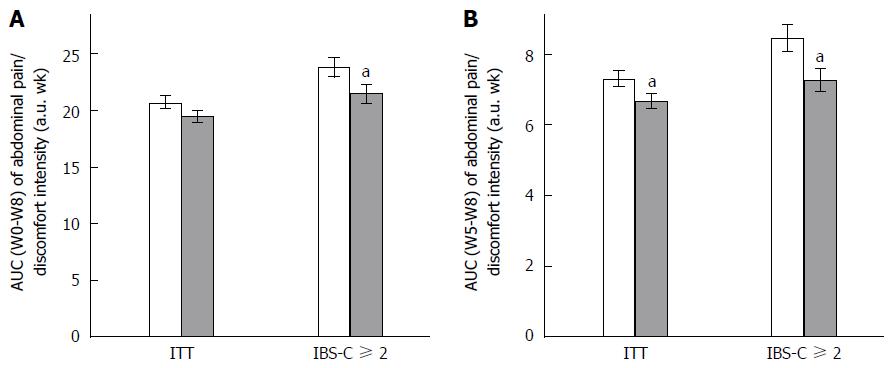
Figure 1 Area under the curve (W0-W8) (A) and area under the curve (W5-W8) (B) of abdominal pain/discomfort in intent to treat population (all irritable bowel syndrome subtypes) and in irritable bowel syndrome-C subjects with an abdominal pain/discomfort score higher than or equal to 2 at baseline (irritable bowel syndrome-C ≥ 2) under placebo (white) or Saccharomyces cerevisiae CNCM I-3856 (grey) supplementation.
Significant differences compared to placebo are symbolized by aP < 0.05. IBS-C: Irritable bowel syndrome-C; a.u.: Arbitrary unit; ITT: Intent to treat; AUC: Area under the curve.
- Citation: Cayzeele-Decherf A, Pélerin F, Leuillet S, Douillard B, Housez B, Cazaubiel M, Jacobson GK, Jüsten P, Desreumaux P. Saccharomyces cerevisiae CNCM I-3856 in irritable bowel syndrome: An individual subject meta-analysis. World J Gastroenterol 2017; 23(2): 336-344
- URL: https://www.wjgnet.com/1007-9327/full/v23/i2/336.htm
- DOI: https://dx.doi.org/10.3748/wjg.v23.i2.336


