Copyright
©The Author(s) 2017.
World J Gastroenterol. May 21, 2017; 23(19): 3449-3467
Published online May 21, 2017. doi: 10.3748/wjg.v23.i19.3449
Published online May 21, 2017. doi: 10.3748/wjg.v23.i19.3449
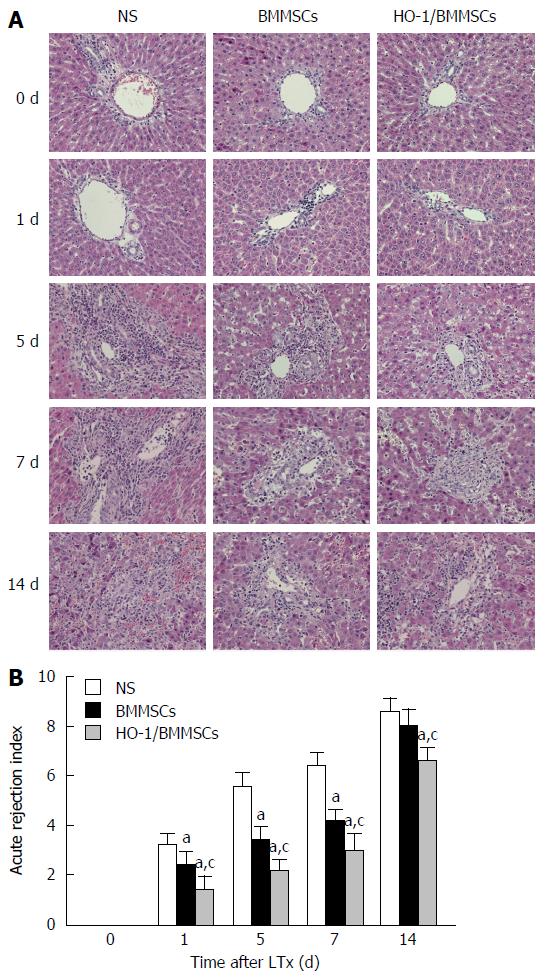
Figure 2 Histological changes of the rat liver and grading of acute cellular rejection after reduced size liver transplantation.
A: Hematoxylin and eosin staining of the transplanted liver (× 200): Rejection injuries were aggravated with increased post-operative time in all three groups. Histopathologically, the transplanted liver in the NS group showed obvious congestion in the hepatic sinus, hepatocyte swelling, mainly eosinophilic degeneration, and punctate necrosis. The infiltration of a large volume of mixed lymphocytes in the central vein and the portal area was accompanied by disordered hepatic lobules and necrosis of hepatocytes on postoperative day (POD) 5. Infiltration of inflammatory cells and necrosis of hepatocytes deteriorated on POD7. The mixed lymphocyte infiltration became significant on POD14, with severe hepatic sinus congestion, hepatocyte destruction, and disappearance of the lobular structure. Inflammatory cells infiltration, hepatocyte destruction, and lobular destruction of the transplanted liver in BMMSCs group were less severe than those in the NS group. HO-1/BMMSCs group showed less rejection, and fewer injuries of liver allografts compared with the BMMSCs and NS groups at each time point, without obvious hepatic sinus congestion, large volume of inflammatory cells infiltration, or disorder of the lobular structure; B: Grading of acute cellular rejection (ACR): The rejection injuries tended to deteriorate with increasing post-operative time in all groups. Rejection in the HO-1/BMMSCs group was significantly less severe than that in the BMMSCs and NS groups at all time points (P < 0.05). POD1: HO-1/BMMSCs group vs BMMSCs group vs NS group: 1.40 ± 0.55 vs 2.40 ± 0.55 vs 3.20 ± 0.45 (P < 0.05). POD5: HO-1/BMMSCs group vs BMMSCs group vs NS group: 2.20 ± 0.45 vs 3.40 ± 0.55 vs 5.60 ± 0.55 (P < 0.01). POD7: HO-1/BMMSCs group vs BMMSCs group vs NS group: 3.00 ± 0.71 vs 4.20 ± 0.45 vs 6.40 ± 0.55 (P < 0.01). POD14: HO-1/BMMSCs group vs NS group: 6.60 ± 0.55 vs 8.60 ± 0.55 (P < 0.01); HO-1/BMMSCs group vs BMMSCs group: 6.60 ± 0.55 vs 8.00 ± 0.71 (P < 0.01). aP < 0.05 vs NS group, cP < 0.05 vs HO-1/BMMSCs group.
- Citation: Yang L, Shen ZY, Wang RR, Yin ML, Zheng WP, Wu B, Liu T, Song HL. Effects of heme oxygenase-1-modified bone marrow mesenchymal stem cells on microcirculation and energy metabolism following liver transplantation. World J Gastroenterol 2017; 23(19): 3449-3467
- URL: https://www.wjgnet.com/1007-9327/full/v23/i19/3449.htm
- DOI: https://dx.doi.org/10.3748/wjg.v23.i19.3449


