
















©The Author(s) 2017.
World J Gastroenterol. May 21, 2017; 23(19): 3440-3448
Published online May 21, 2017. doi: 10.3748/wjg.v23.i19.3440
Published online May 21, 2017. doi: 10.3748/wjg.v23.i19.3440
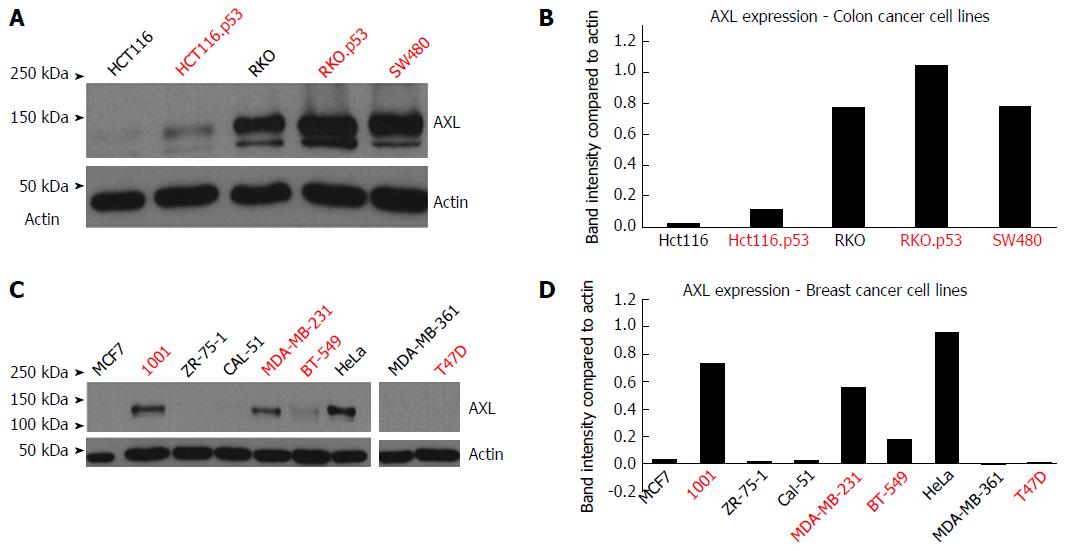
Figure 1 Western blot analysis of AXL protein levels in cancer cell lines.
A: Colon cancer cell lines HCT116, HCT116.p53, RKO, RKO.p53-/- and SW480. A band of 140 kDa was observed in AXL positive samples. Actin was used as a loading control; B: This graph shows the quantification of band intensity in comparison to Actin using the “ImageJ” program; value analysis was done using MS Excel. Red font indicates p53 mutation; C: Breast cancer cell line MCF7, MCF7-TP53 mutant clone 1001, ZR-75-1, CAL-51, MDA-MB-231, BT-549, MDA-MB-361, and T47D. HeLa was used as positive control for EMT. Actin was used as a loading control; D: This graph shows the quantification of band intensity in comparison to Actin using the “ImageJ” program and value analysis was done using MS Excel. Red font indicates p53 mutation.
- Citation: Abdel-Rahman WM, Al-khayyal NA, Nair VA, Aravind SR, Saber-Ayad M. Role of AXL in invasion and drug resistance of colon and breast cancer cells and its association with p53 alterations. World J Gastroenterol 2017; 23(19): 3440-3448
- URL: https://www.wjgnet.com/1007-9327/full/v23/i19/3440.htm
- DOI: https://dx.doi.org/10.3748/wjg.v23.i19.3440