Copyright
©The Author(s) 2017.
World J Gastroenterol. May 14, 2017; 23(18): 3356-3366
Published online May 14, 2017. doi: 10.3748/wjg.v23.i18.3356
Published online May 14, 2017. doi: 10.3748/wjg.v23.i18.3356
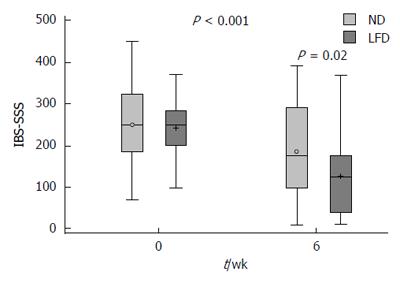
Figure 3 Box plot of irritable bowel syndrome-severity score system crude data in means ± SD, medians (range) for the normal diet and low FODMAP diet groups at 0 vs 6-wk.
IBS: Irritable bowel syndrome; SSS: Symptom severity score; ND: Normal diet; LFD: Low-FODMAP diet.
- Citation: Pedersen N, Ankersen DV, Felding M, Wachmann H, Végh Z, Molzen L, Burisch J, Andersen JR, Munkholm P. Low-FODMAP diet reduces irritable bowel symptoms in patients with inflammatory bowel disease. World J Gastroenterol 2017; 23(18): 3356-3366
- URL: https://www.wjgnet.com/1007-9327/full/v23/i18/3356.htm
- DOI: https://dx.doi.org/10.3748/wjg.v23.i18.3356


