Copyright
©The Author(s) 2017.
World J Gastroenterol. Apr 28, 2017; 23(16): 2940-2947
Published online Apr 28, 2017. doi: 10.3748/wjg.v23.i16.2940
Published online Apr 28, 2017. doi: 10.3748/wjg.v23.i16.2940
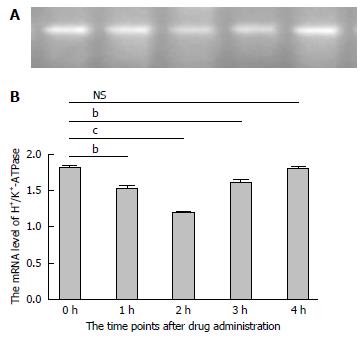
Figure 3 mRNA expression of H+/K+-ATPase.
A: A typical RT-PCR result; B: The mRNA expression of H+/K+-ATPase in different groups. cP < 0.001, bP < 0.05; NS: No significant difference.
- Citation: Yang GT, Zhao HY, Kong Y, Sun NN, Dong AQ. Study of the effects of nesfatin-1 on gastric function in obese rats. World J Gastroenterol 2017; 23(16): 2940-2947
- URL: https://www.wjgnet.com/1007-9327/full/v23/i16/2940.htm
- DOI: https://dx.doi.org/10.3748/wjg.v23.i16.2940


